The SEO guide to the Google Lighthouse tool
Google Lighthouse is fast becoming one of my favourite technical tools for auditing mobile websites. Many still use the tool to audit the web performance (site speed) of their mobile webpages but the tool can offer much more guidance on how to improve a webpage or app.
In this article I will run through what Lighthouse is and how the audits in the tool can be used to improve the quality of your webpages.
Contents
What is Google Lighthouse?Lighthouse tool vs PageSpeed Insights tool
How does Lighthouse work?
Why Lighthouse is a useful technical SEO tool
How can Google Lighthouse be installed?
Summary
What is Google Lighthouse?
Lighthouse is an open-source automated tool developed by Google to help web developers improve the quality of websites and applications.
It can be run against any page, whether public or private. The tool audits and provides a digestible report based on the following areas:
- Web Performance (Site Speed)
- Progressive Web App (PWA)
- Accessibility
- Best Practices
- Search Engine Optimisation (SEO)
Lighthouse tool vs PageSpeed Insights tool
As an agency we are constantly asked what the differences are between the PageSpeed Insights tool and the Lighthouse tool. Why do they provide different site speed scores? There are a few reasons why the tools are different, and it is mainly due to the limitations of PageSpeed Insights.
Tool optimisation scores
The PageSpeed Insight tool scores desktop and mobile content based upon the pages passing individual factors and best practices. It does not take into account real world page speed metrics (time to first byte, Page Weight, Speed Index, etc.)
Although the tool has been updated to include real world speed scores, based upon the Chrome User Experience Report (CrUX), this is only for the top 3 million websites. So, it is useless for the average website owner.
Optimisation recommendations
The PageSpeed Insights tool does not provide up-to-date site speed recommendations based on current web development best practices. For example, the tool does not take into account HTTP/2 or external links which don’t have rel=”noopener”.
Simply put, the Lighthouse tool provides better real time site speed scores and more up-to-date technical recommendations than the PageSpeed Insights tool.
How does Lighthouse work?
I’m not going to go into a huge amount of detail about how the tool works but the Lighthouse team have created a very nice diagram highlighting how the Lighthouse tool works when run on GitHub.
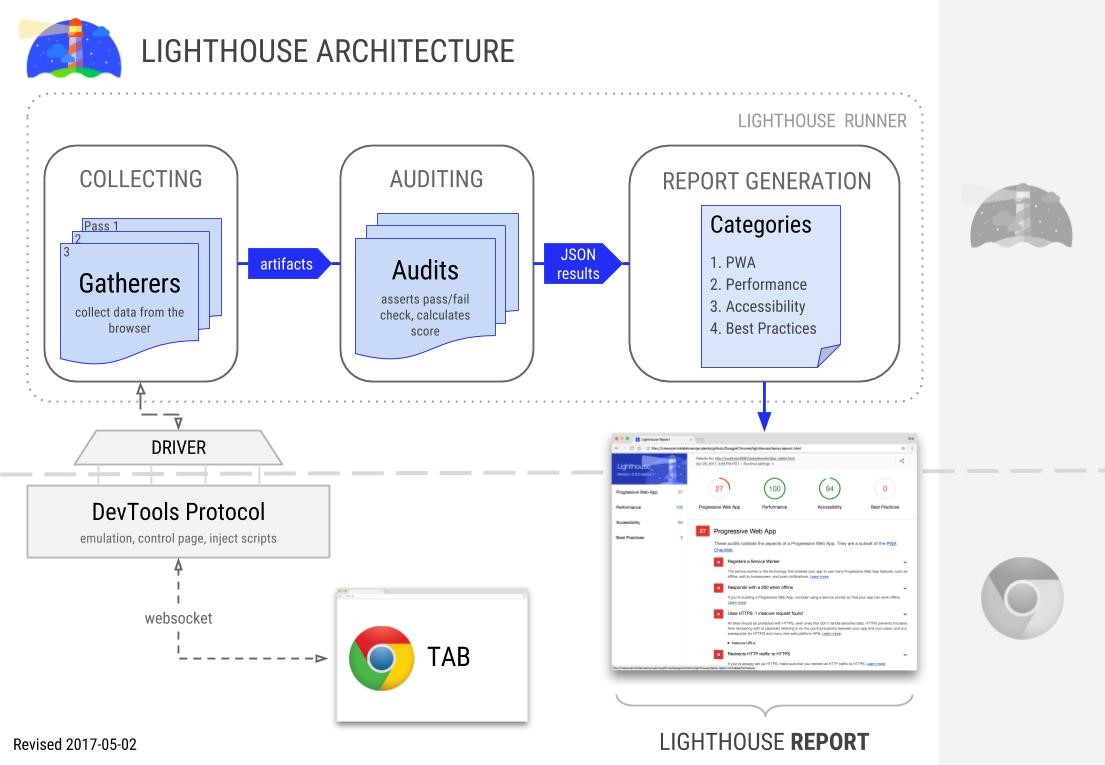
To summarise quite quickly how the tool works, Lighthouse audits any URL specified by the user and generates a report on how well the page did for each factor selected out of 100. It then generates a digestible report as shown in the image below.
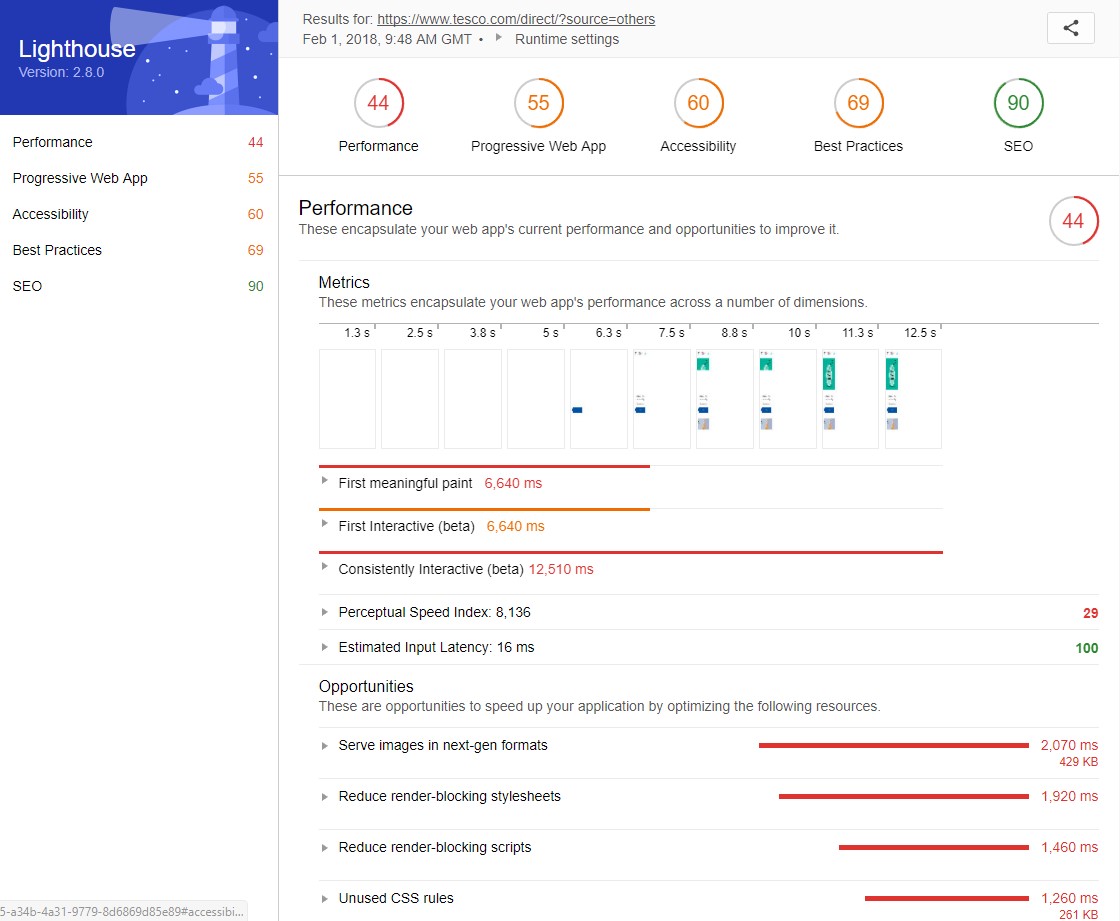
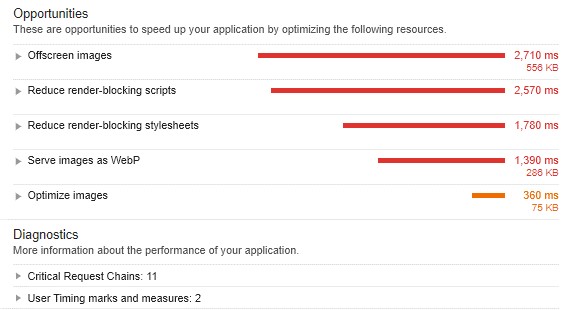
For each area selected by the user, the tool provides a comprehensive report highlighting how a website can improve the quality of its web pages.
From my own experience, I’ve come across barriers in getting digital, development and IT teams to implement recommendations based on web performance third-party tools. The fact that Lighthouse is a Google tool which provides further detail around performance than the standard PageSpeed Insights tool (more on this later) is crucial in getting impactful actions completed.
Easily share audits with other teams
What is also quite useful is that you can print or save audits to share with other teams in the Chrome Extension version of the tool.

Many people believe that a Lighthouse audit is run and that’s that, but you can always save it for later to share with technical teams or refer back to it. One thing I’d like to see the Lighthouse team add is the ability to save the report as a PDF. This way, it could be shared with less technical individuals and opened easily.
Unfortunately, the features aren’t available in Google Developer tools. All you can do is download the report in JSON.
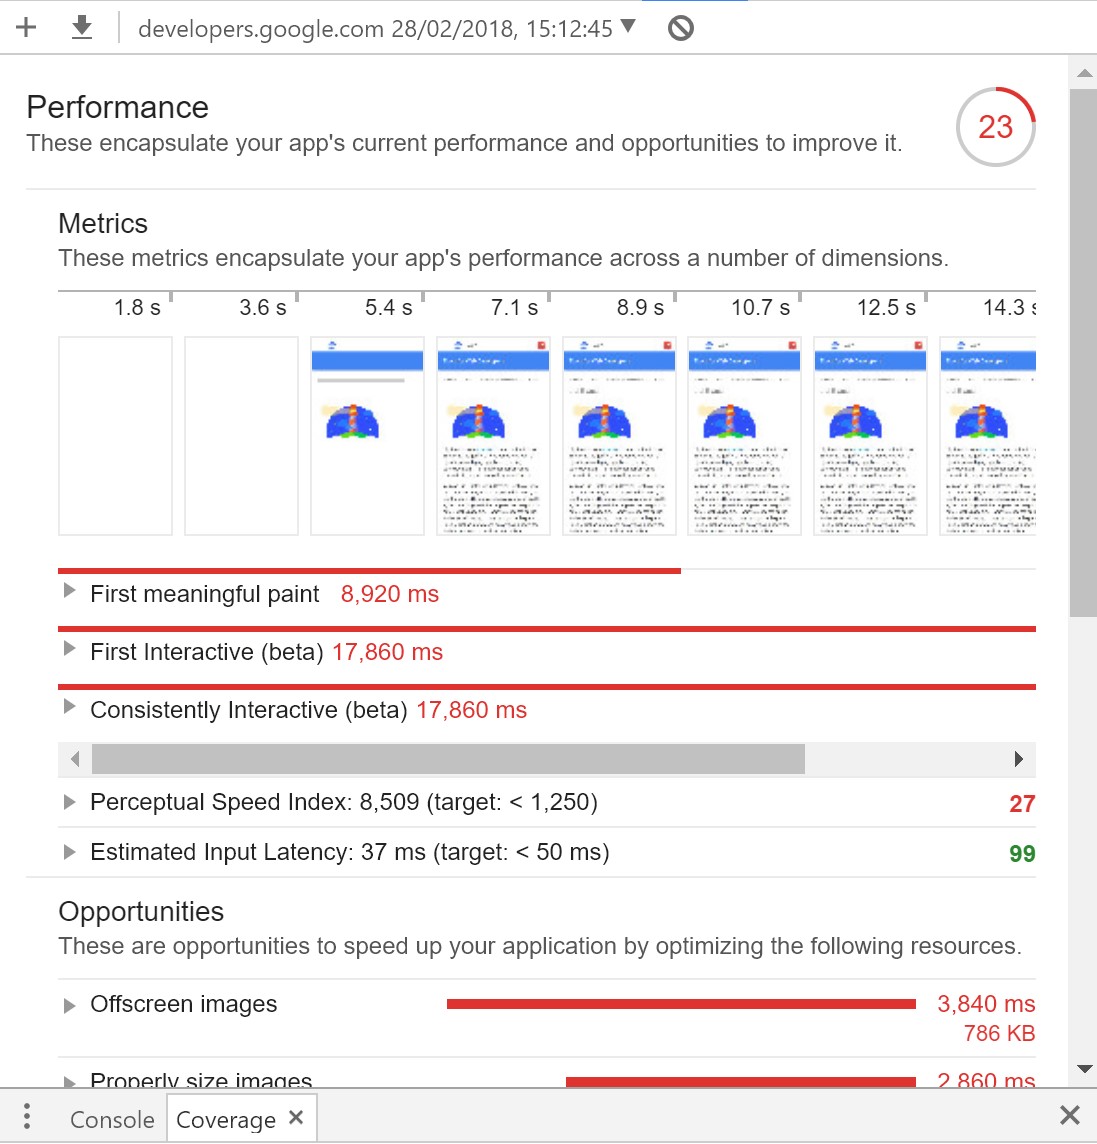
This can be viewed when uploaded to the Lighthouse Report Viewer.
Again, it would be good if we could save the reports in a PDF or HTML document so many users can share the report with other teams. As not everyone is aware of the Lighthouse Report Viewer.
Emulates Nexus 5 devices
It’s important to remember that any default Lighthouse tool audit will be based on a Nexus 5 and fast 3G connection — as you can see from the image below.

The setting for the tool I find very interesting. Much of Google’s research on mobile site speed seems to be based upon Nexus 5 devices (even recent studies in 2017). As Lighthouse uses these settings as default, it means that when you run the tool you are using the same settings Google seems to favour when judging a website’s mobile site speed. For this reason, I play very close attention to the Performance score in Google Lighthouse, and the opportunities which are highlighted.
Why Lighthouse is a useful technical SEO tool
The most useful part of the tool is the number of technical issues and actions it highlights. Below I have run through each audit and commented on how useful they are for SEOs and website owners.
Performance
The Performance report is one of the most useful parts of the Lighthouse tool (in my opinion). It provides a breakdown of the key milestones of how quickly a page loads (First meaningful paint, First Interactive and Consistently Interactive).
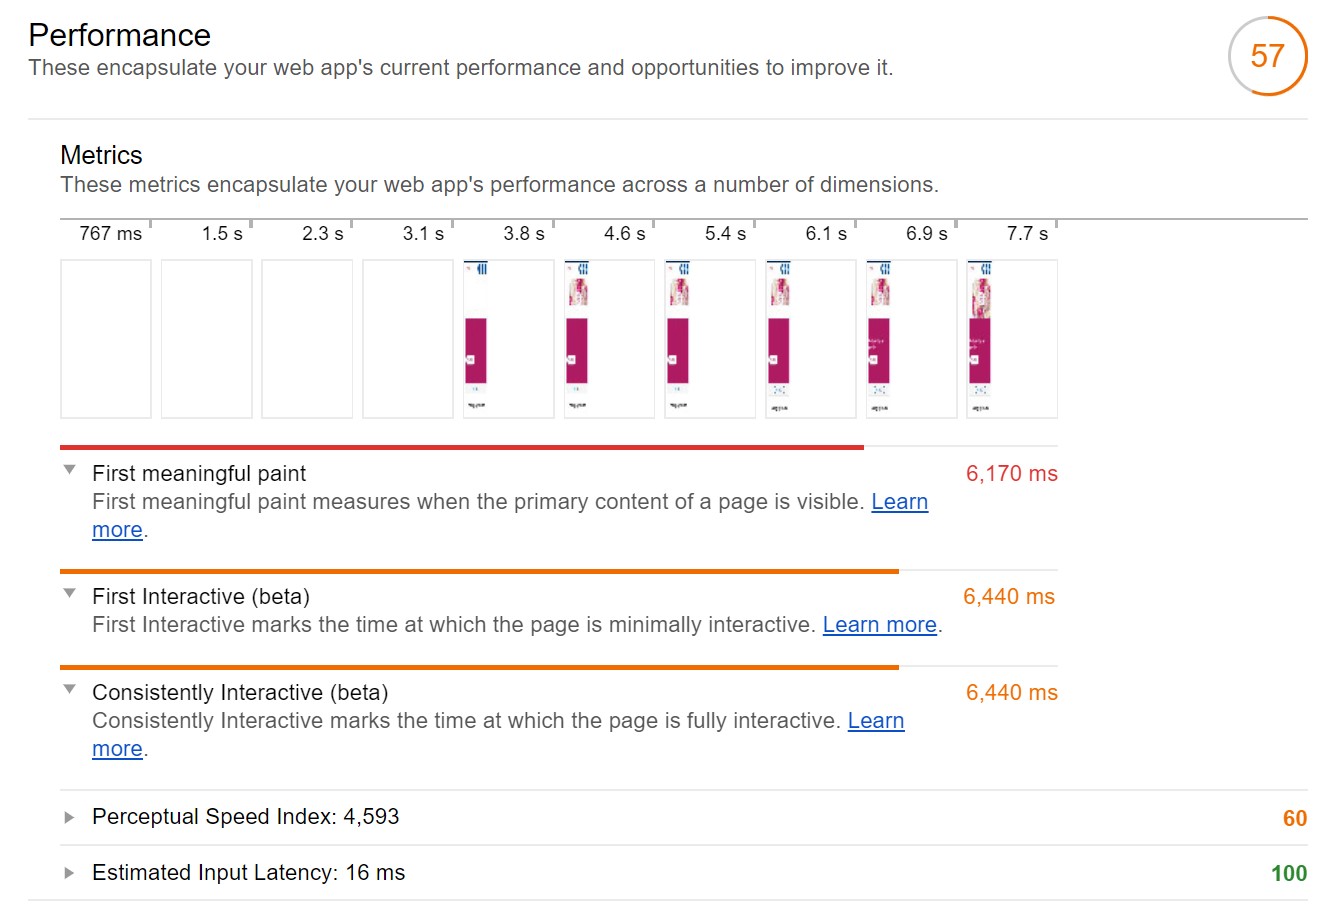
Next the report provides the Perceptual Speed Index and the Estimated Input Latency. These metrics are useful for benchmarking a mobile website’s pages against, using these metrics to improve their performance.

Finally, a really important aspect of the tool is highlighting the issues which are causing a low Performance score.
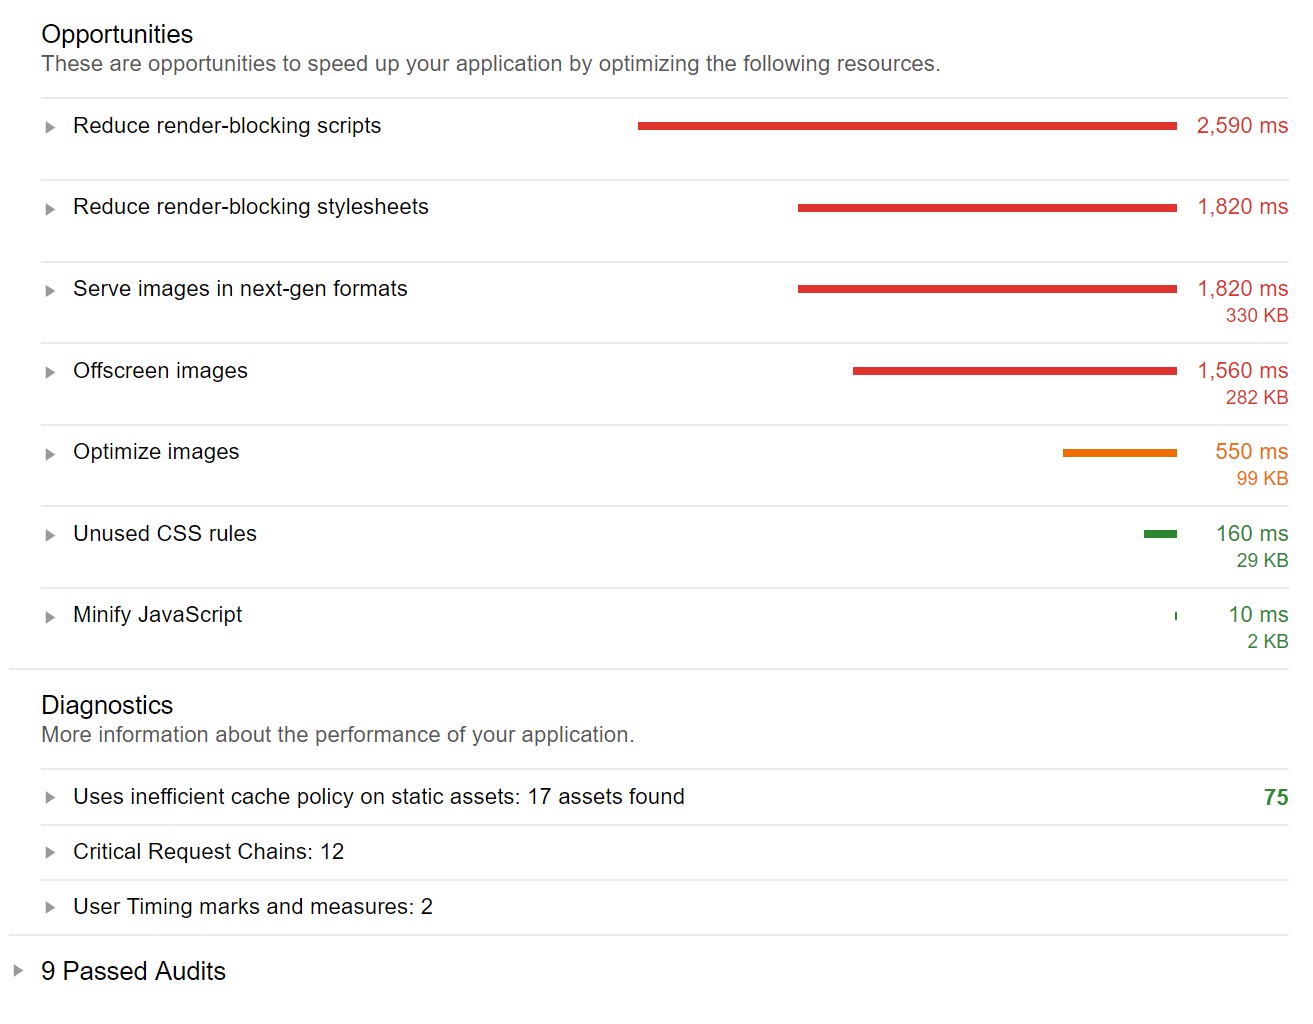
The actions are prioritised by the impact they have on the web performance (site speed) of a page, which is useful when communicating to web development teams which recommendations will have the greatest impact.
Within the Performance audit I tend to focus our client teams on improving the overall score, although I find the the most impactful recommendations should focus on improving the perceptual speed index and the estimated input latency. Google does not use mobile site speed as a ranking factor but they have announced that the page speed ranking algorithm is switching from desktop content to mobile in July 2018.
As many businesses neglect the mobile version of their website, causing mobile site speed scores to be lower than desktop, this will hopefully be a wakeup call. The Performance audit in the Google Lighthouse tool is perfect for auditing mobile webpages to make sure they are not at risk of being impacted.
If you run the tool and you are in the red, then I highly recommend doing something about it!

Progressive Web App
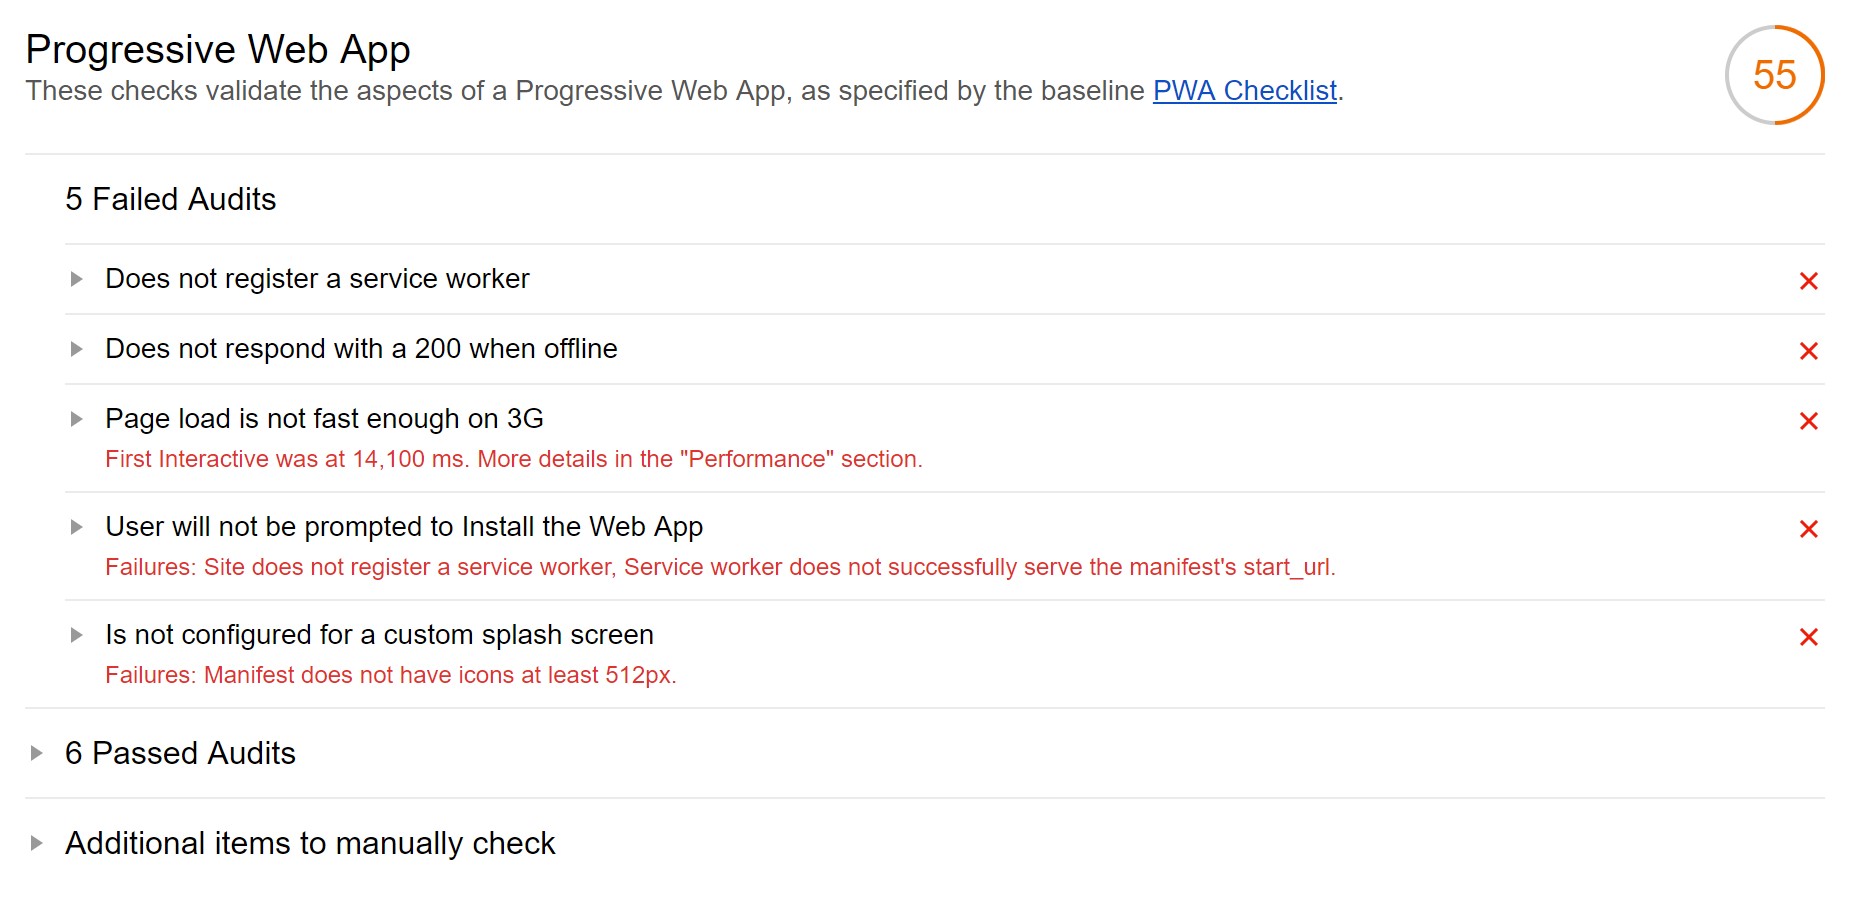
I’m not going to touch on this too much as I don’t think this audit will be used as much as others in the everyday life of a technical SEO or website owner.
Accessibility
I think a lot of technical SEOs and website owners will ignore or miss this audit but there are a number of useful recommendations that the tool can provide which can help improve the overall user experience — especially for those who require assistant technology, such as screen readers.
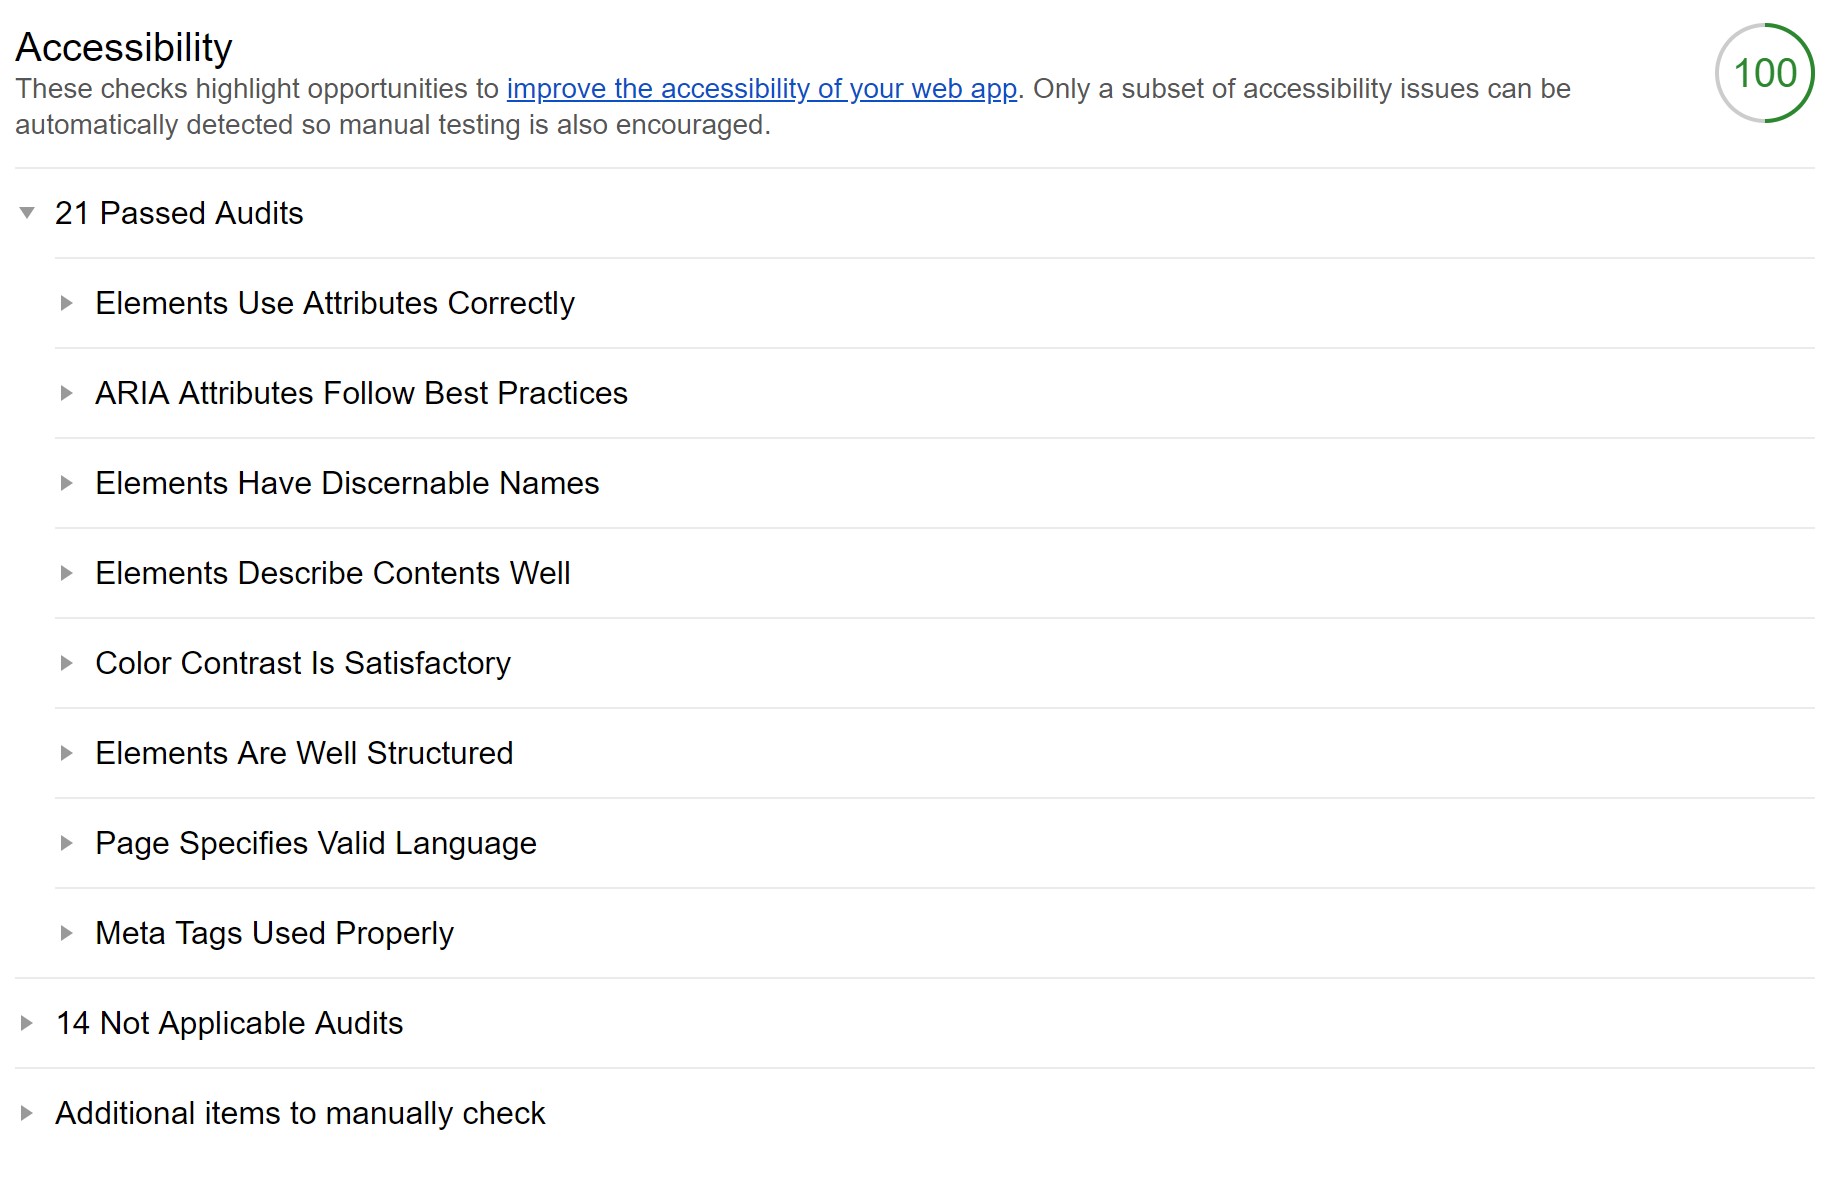
A number of examples which I have found useful:
- Color Contrast Is Satisfactory: recommendation highlights that certain text is not legible
- Page Specifies Valid Language: highlights if the HTML Lang attribute is being used
- Image elements have [alt] attributes: highlights images which don’t have ALT tags (also required for SEO image optimisation)
Many webmasters struggle with highlighting and addressing accessibility problems, and I think the fact that the Lighthouse tool provides these recommendations is a great way for people to improve their mobile websites for those who rely on accessibility technology.
Best practices
This report has a few gems in it which I wouldn’t have thought to check. Although many will simply use the Lighthouse tool for the Performance and SEO audits, I highly recommend running the Best Practice audit as well. It can provide recommendations which can improve both your Performance and user experience for mobile websites.
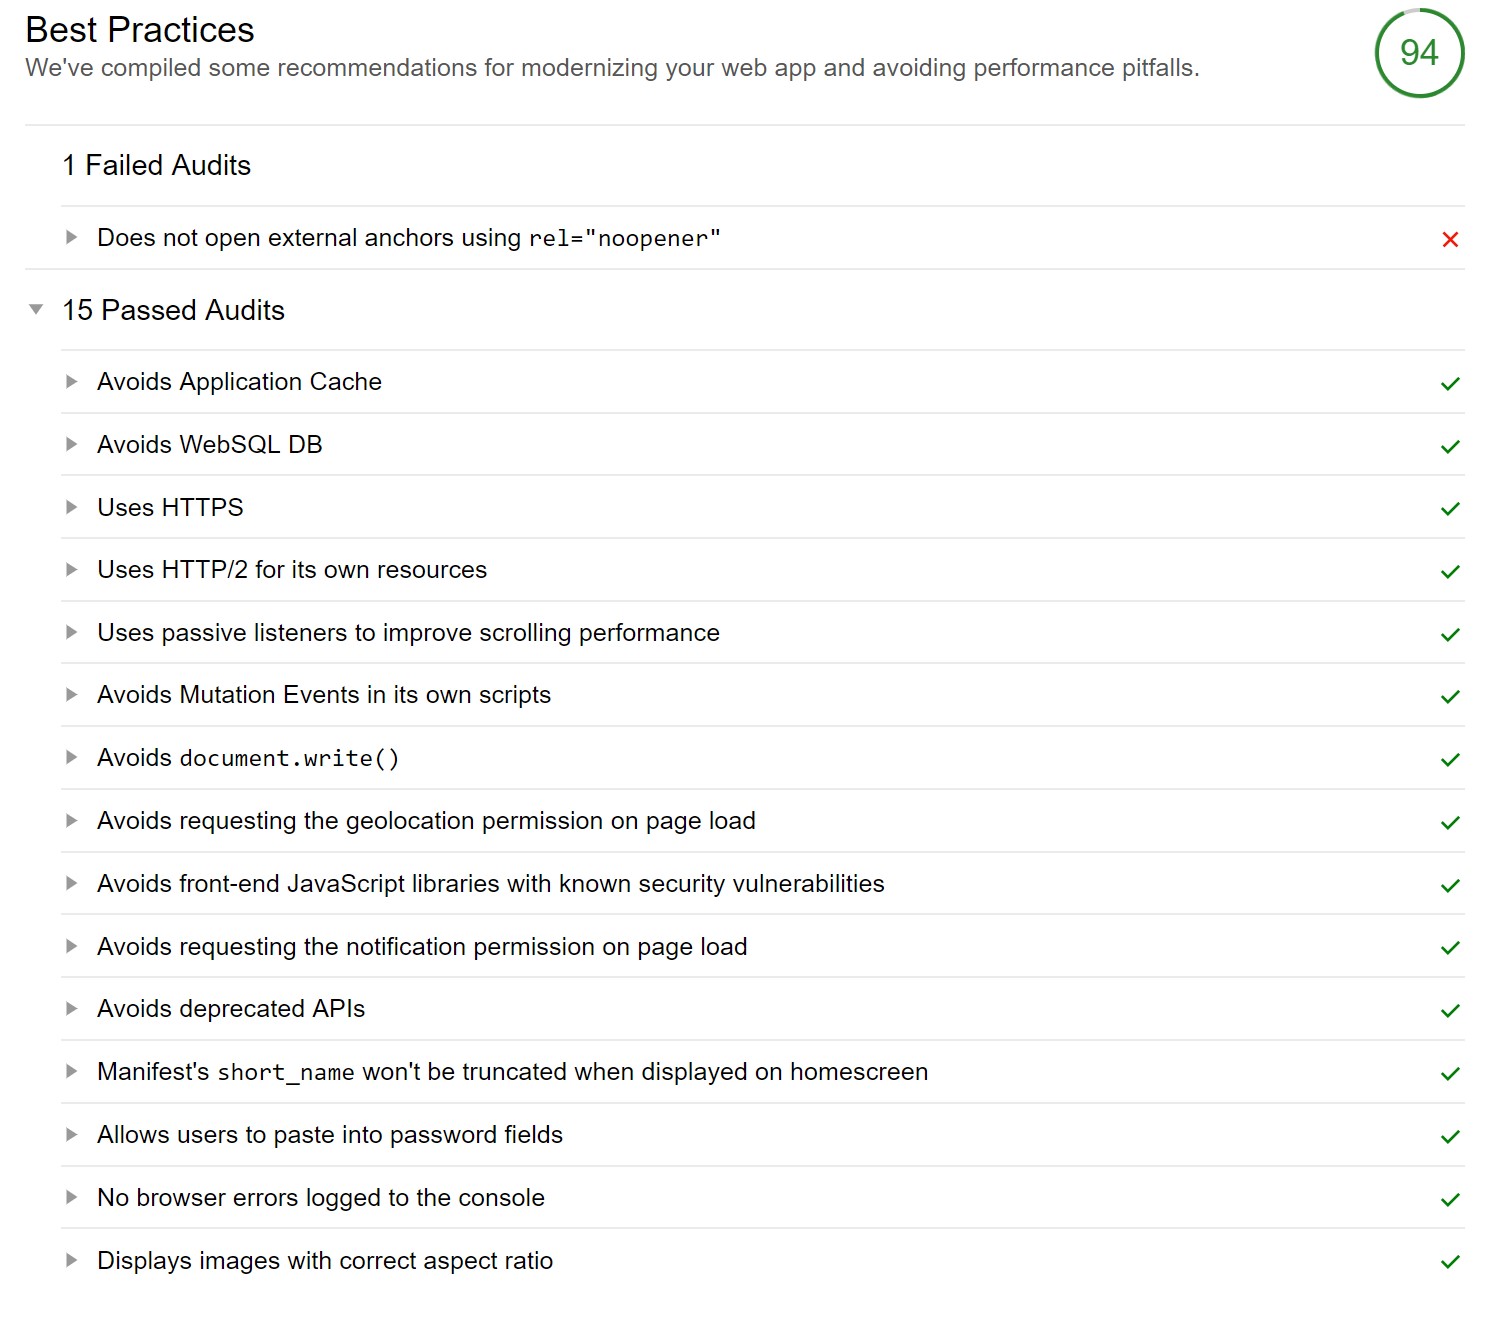
Just to highlight some examples of recommendations which I found useful:
- Uses HTTP/2 for its own resources: highlights if all internal resources are using the HTTP/2 protocol. Using HTTP/2 on your website can significantly improve your site speed.
- Uses Passive Event Listeners to Improve Scrolling Performance: a great issue to highlight on mobile which improves how quickly users scroll through your website.
- Displays images with correct aspect ratio: highlights which images can be resized to help improve the site speed of a mobile page.
- Avoid front-end JavaScript libraries with known security vulnerabilities: highlights if your website is using JavaScript which has known security vulnerabilities. If this is exploited it could cause you to be hacked and potentially removed from search results if Google picks it up.
I’ve found the Best Practices audit to be quite useful for improving the user experience of a client’s mobile website. If you’re serious about improving the quality of your mobile webpages I would highly recommend running this audit in the Lighthouse tool.
Search engine optimisation
Ironically, this is probably the worst of the audits in the Lighthouse tool. Just running through the list of opportunities and recommendations from the report, it all seems very basic. Also, the tool checks the quality of the meta tags. Just because a webpage has a meta tag doesn’t mean that it follows SEO best practice.
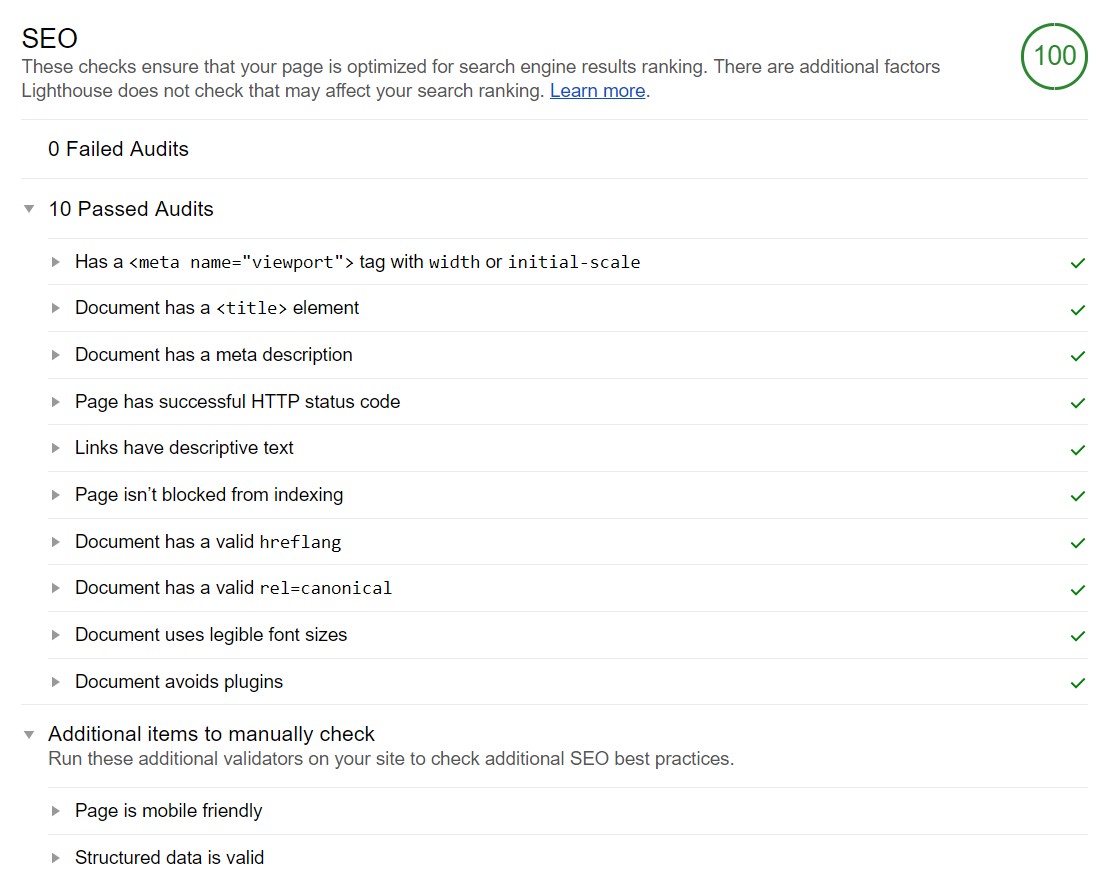
There are better SEO tools out there which check for meta tag issues on the mobile version of a website ( for e.g., Sitebulb, Screaming Frog Web Crawler, etc.) We also need to remember that this is only the first release of the SEO audit in the tool, and it’s exciting to see that developers are adding in SEO audits for a tool that checks the quality of a webpage or app. It’ll be interesting to see what they add next.
Despite many checks not being useful, I have found that the ‘document uses legible font sizes’ check within the audit very useful to improve the quality of a mobile website. Any font size which is less than 16px is too small for mobile users to read, which causes them to pinch and zoom in on mobile content.
How can Google Lighthouse be installed?
If you’re interested in using the Lighthouse tool, then there are a number of ways it can be installed and run to audit your webpages.
Google Chrome
One of the easiest ways to run Lighthouse is in Google Chrome. To use it, follow these simple steps:
- Navigate to the webpage you wish to run the audit on.
- Right click on the page and click inspect element.
- This will open Google Developer tools. In here you will need to navigate to the Audits.
- Navigating to this tab, you should see the Lighthouse logo and CTA which says “Perform an audit…”.
- Simply click on the Audit button and it should show you 4 options to run. Select whichever one you want.
- Hit “Run Audit” and wait for Lighthouse to run and display its digestible report.
Please be aware that the Search Engine Optimisation (SEO) audit option is not available from Chrome Developer tools.
Google Chrome Extension
The Lighthouse tool is available in a handy Chrome extension on the Google Chrome Web Store. This allows users to quickly run the tool on a page without having to go into the Chrome Developer tools.
To run the Lighthouse Chrome extension all you will need to do is:
- Download the extension and add it to your Google Chrome browser.
- Navigate to the webpage you want to audit.
- Hit the Lighthouse Chrome extension icon and let Lighthouse run.
Please be aware that the Search Engine Optimisation (SEO) audit option is available in the Lighthouse Chrome extension.
Node Command Line Interface (CLI)
The Lighthouse tool can also be run in the Node.js command line. This is more for technical people who want to use the tool and it isn’t really necessary to use this version unless you want to automate running Lighthouse.
To run Lighthouse in Node you will need to:
- Download and install Google Chrome.
- Install a current and stable version of Node (this needs to be version 6 or higher).
- Run the following command line to install the global Lighthouse npm package:
npm install -g lighthouse
- Once installed, simply run the Lighthouse tool by typing the following command into the CLI:
lighthouse https://airhorner.com/
- You can also use a number of CLI options (also known as flags) to customise your reports. A list of options can be found on the Lighthouse Github.
- Running the node CLI by default will save a HTML version of the report which can be saved and shared.
Please be aware that the Search Engine Optimisation (SEO) audit option is available in the Lighthouse Node CLI.
Summary
The Google Lighthouse tool is used by many to measure and benchmark the site speed of their pages. However, there is a lot more to the tool to help you audit and improve the quality of your webpage or app.
If you’re not using Lighthouse as part of your mobile or technical SEO audits, then you’re missing out on improving the quality of your website.
More information on Lighthouse and helpful links about the tool can be found below:
- Lighthouse – https://developers.google.com/web/tools/lighthouse/
- Github Lighthouse – https://github.com/GoogleChrome/lighthouse
- Lighthouse Chrome Extension – https://chrome.google.com/webstore/detail/lighthouse/blipmdconlkpinefehnmjammfjpmpbjk.
- Lighthouse Report Viewer – https://googlechrome.github.io/lighthouse/viewer/
- Contribute to the Lighthouse project – https://github.com/GoogleChrome/lighthouse/blob/master/CONTRIBUTING.md