What are Core Web Vitals?
Web Vitals are metrics created by Google to measure page performance in a standardised way. Google analyses real user data from the Chrome User Experience Report (CrUX) and compares the real experience of these users to see where they fall within the Web Vitals metrics. The Core Web Vitals are then used by Google as part of their Page Experience Algorithm – these are LCP, CLS, and FID.
This article is the first in a series on Core Web Vitals. We’ll be covering an introduction to what each Core Web Vital metric is, as well as how to identify whether a site fails any of these metrics and, if so, how to approach auditing them.
What is LCP?
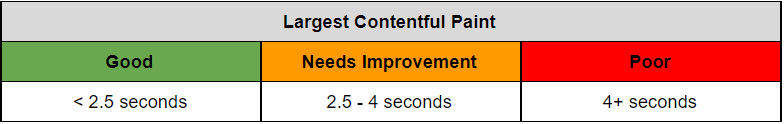
LCP stands for “Largest Contentful Paint”. This is the time it takes the largest above-the-fold element to be rendered (or “painted”).
Essentially, LCP gives Google a standardised way to measure page speed. Measuring the entire page load time isn’t an accurate way to report on page speed since user interactions with the page can extend the load time. LCP, however, only looks at the initial page load, before most users will have a chance to interact.
The LCP metric prioritises loading the largest above-the-fold element within 2.5 seconds. Conversely, an LCP between 2.5 and 4 seconds will be classed as “Needs Improvement” and an LCP higher than 4 seconds will be classed as “Poor”.
What is CLS?
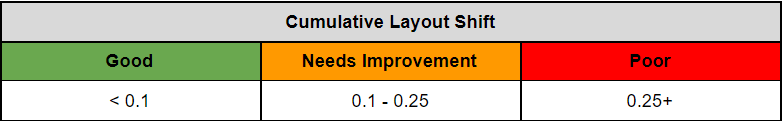
CLS stands for “Cumulative Layout Shift”. Designed to tackle the poor user experience of elements bouncing around the page, CLS measures the movement of elements, based on the “Layout Shift Score” created by Google.
The Layout Shift Score is based on the size of a shifting element in comparison to the viewport – impact fraction – and the distance the element moves in comparison to the viewport – distance fraction.
The equation for CLS is as follows:
Layout Shift Score = impact fraction * distance fraction
Sometimes you can see a lot of little shifts happening throughout the page load time. Previously, these would all have been aggregated together to form the CLS score. However, Google found that this wasn’t overly representative of the user experience.
To better focus the score on improving user experience, Google now looks at the page broken down into five second brackets, each with its own individual CLS scores. The bracket with the highest CLS score will then become the overall CLS score for the page.
What is FID?
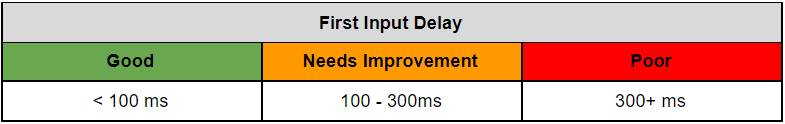
FID stands for “First Input Delay”. Focusing on how long it takes a browser to begin the first user interaction with an interactable element, FID is a Google metric, designed to measure how responsive a page is to user input.
FID does not measure the time it takes to fully process an interaction, only the time it takes to begin processing it. This is partly because the latter is easier to standardise across the web, as well as Google’s wish to not incentivise the introduction of workarounds.
To create a standardised way of measuring this initial responsiveness, FID measures the time between the user’s interaction with an interactable element and the time it takes for the main thread to become available to process that interaction.
Because the FID requires user interaction for it to be measured, it tends not to be reported as often as LCP and CLS (both of which, conversely, only require a page to be rendered). It is also more likely to be seen on sites that require a high amount of user interaction, in opposition to more static sites such as blogs. However, this does not mean you should remove all interactable elements from a page, simply that you should be aware of the processing time behind these elements.
Additionally, because of the lack of sites reporting FID issues, Google is looking to introduce a new metric to better identify issues with page interaction time. This metric will use high quantile approximation, which will:
“Compute the largest 10 interactions over budget and choose a value from that list depending on the total number of interactions. Given N total interactions, select the (N / 50 + 1)th largest value, or the 10th value for pages with more than 500 interactions.”
Checking for Web Vital Issues in Search Console
To check for LCP issues in Google Search Console, navigate to “Core Web Vitals” from the side navigation. You will be faced with the dashboards for Mobile and Desktop showing the overview for all Core Web Vital issues.
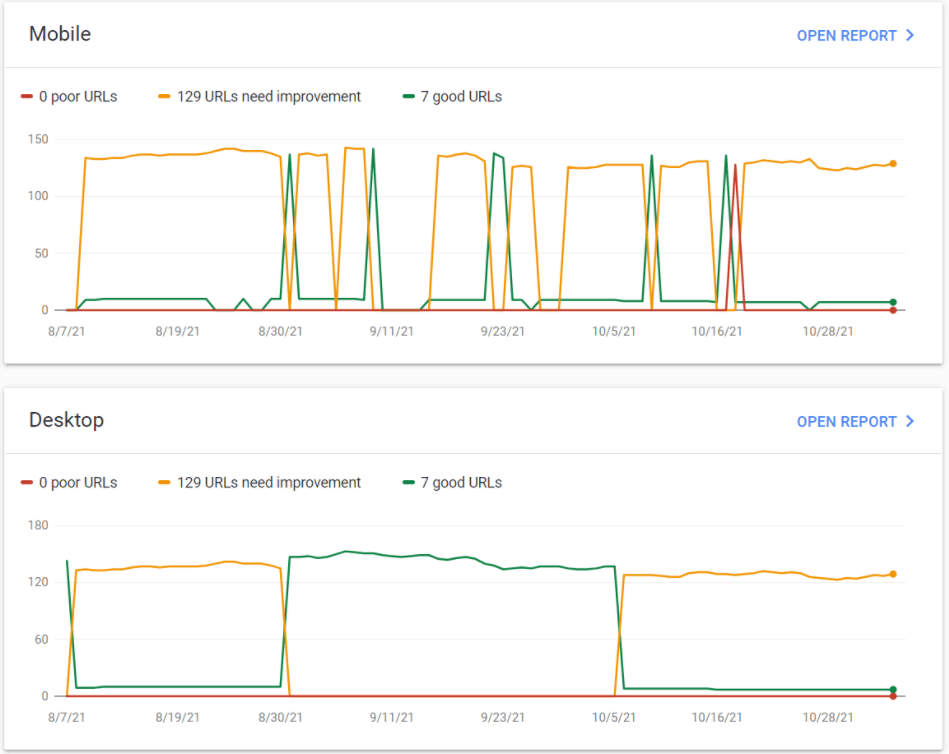
This shows us whether Google has identified any Core Web Vital issues. However, to identify whether there are LCP issues we need to dive a step further into the dashboard by clicking through to the device we want to focus on. Note that mobile and desktop issues will remain separated throughout and you will need to investigate separately.
Once you have clicked through, you can use the Details section to identify how many pages are experiencing issues of each type and severity.
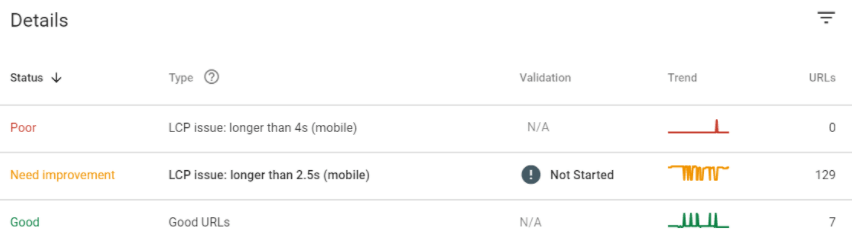
From here, you can click into each issue and find a sample of the pages experiencing it. To understand what the issues are and how to fix them, you will need to investigate pages on a more granular basis, so it is helpful to use the sample to indicate which page templates are experiencing problems and complete further testing on these URLs.
How to check for issues without Google Search Console
If you don’t have Google Search Console access, or would just like another way to check how the site is performing, you can also use Google Page Speed Insights to gain a high-level overview of site performance.
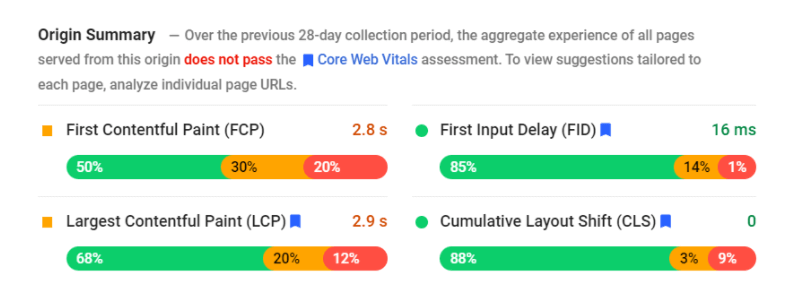
For this, simply enter a URL from the site into Page Speed Insights, and hit go. Once it has completed the audit of that page, you should see an option to View Origin Summary. This will show you a summary of the aggregated data from the CrUX report, with the percentage of visits that did not pass the Core Web Vitals assessment.
Page Speed Insights will also show field data for the individual page you are auditing (if there is enough data), which can help identify which pages need work, even if you do not have access to Google Search Console.
In addition to the CrUX report shown by Page Speed Insights, we can also see the lab data from the tested page. Lab data stems from the Google Lighthouse automated test of the page and is a reflection of how the page performed within a simulated environment, as opposed to the real user data from the CrUX report.
How to audit Core Web Vitals
So you’ve checked your Core Web Vitals and hopefully have an idea of which page templates are seeing issues. Now it’s time to dive into those issues a bit further.
To do this, we have a number of tools at our disposal. We’ll be focusing on Chrome DevTools and WebPageTest as our key auditing tools. While it is possible to just use one tool to audit a site, we find that a mix can help provide the best insight.
How to audit Page Speed with Chrome DevTools
The Lighthouse report in Chrome DevTools will create the same audit report as seen in Page Speed Insights, with two key differences:
- The Chrome DevTools report does not contain field data
- For certain diagnostics (e.g. the element with the Largest Contentful Paint) the Chrome DevTools report lets you hover over the element in the report and highlights the element on the page for you.
The latter of these two makes the Lighthouse audit in Chrome DevTools a far more useful tool than Page Speed Insights when it comes to page-level investigations.
To perform a Lighthouse audit in Chrome DevTools, we should first navigate to the page we want to audit. It is important to do so in Incognito mode if possible, to ensure that the test is not tainted by browser extensions or cookies.
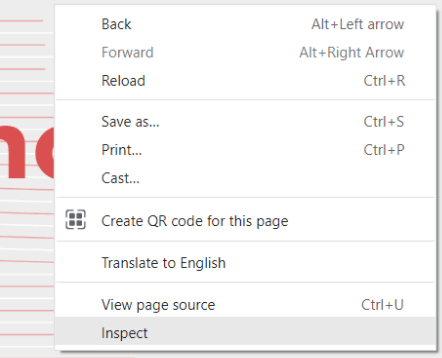
We then need to right-click on the page and click inspect to open up Chrome DevTools. You can also do this using “Option + CMD + J” on macOS, or “Shift + CTRL + J” on Windows.
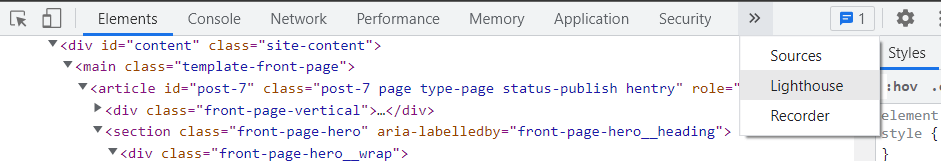
Navigate to the Lighthouse tab at the top of DevTools, as shown below.
We will be given the option of completing the audit from a mobile or desktop perspective. Depending on which we pick, we should also ensure the page view is set to match that device – this will better enable us to use the element highlighting mentioned above.
If we are testing mobile, we need to emulate a mobile viewport using the Device Toggle button shown below.

If we are auditing for Desktop, ensure the viewport is toggled to reflect this instead.
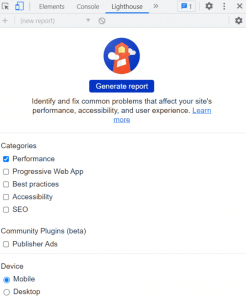
The DevTools Lighthouse report lets us audit items from a number of different categories. For the purpose of Core Web Vitals, we only need to check Performance. However, it’s worth remembering the other categories exist as they can be useful in their own right.
Once we have set our audit to run how we’d like, we can go ahead and click Generate Report.
This will then generate a lab data report for the page we are on, highlighting the metrics we have passed or failed and diagnostics of which page elements and resources saw issues. The report will also provide optimization recommendations that we can use to better improve our performance for each Core Web Vital.
Be aware that the Lighthouse report for Mobile in both DevTools and Page Speed Insights is heavily throttled and may not be representative of what most users see – particularly if they are on a wired connection. However, despite this, it is useful to identify what a worst-case-scenario may look like for a site on a mobile connection.
Additionally, the Lighthouse report in Chrome DevTools is run from your machine, and as such will be limited by your network latency. This is important to be aware of, particularly if you are auditing a site that targets a different location (e.g. auditing a US-only site from the UK).
How to audit Page Speed and Web Vitals with WebPageTest
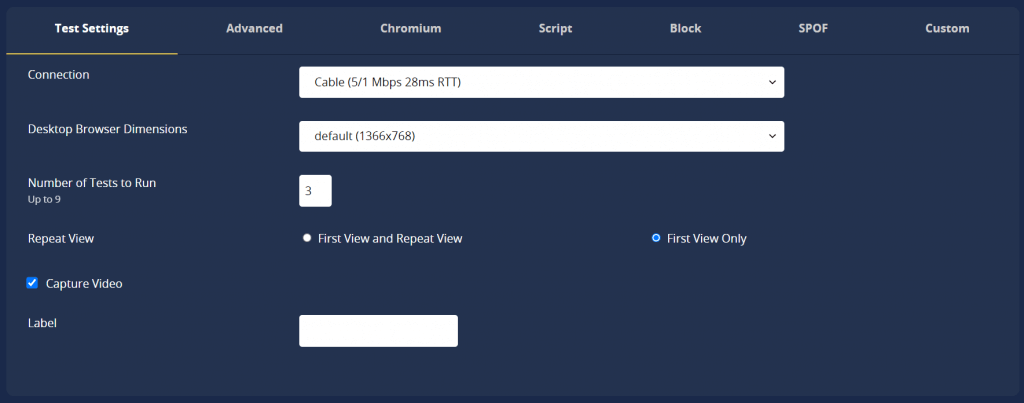
When it comes to WebPageTest, we have more customization options than we had with DevTools. The biggest of these is that we have the option to test from a wired connection if we so wish.
Another customization WebPageTest offers is the ability to capture a video of the page load. This can be very helpful when it comes to visualising page load in reports or meetings, as well as offering a great analysis tool for us to see in real-time where certain issues happen (such as being able to spot layout shifts).
WebPageTest also has the option to test on a mobile or desktop device, similar to DevTools.
Once we have set up the test to fit our audit criteria, we can select our audit location. WebPageTest has the benefit of allowing you to select your location. This can be really useful for generating data for a site that targets a different location than the one you are in.
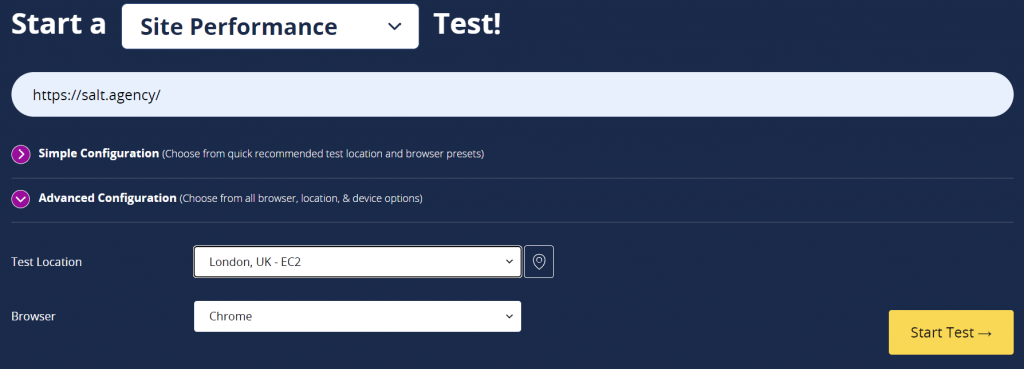
With all of the above selected, we can enter the URL and hit “Start Test”. Be aware that it may take some time for your audit to complete.
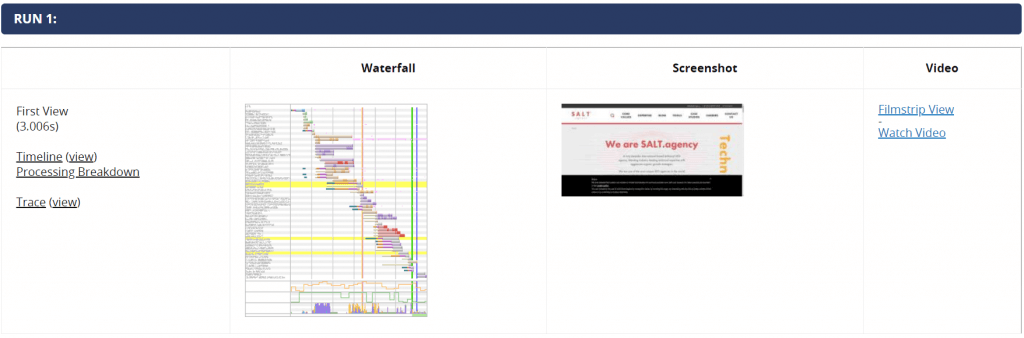
We will then be presented with an overview with aggregated scores if you performed more than one test. From here, we have a few different viewing options.
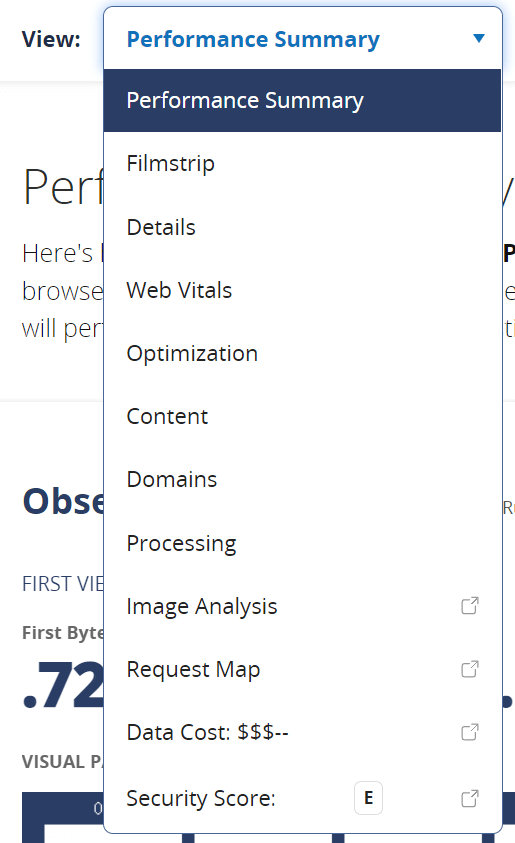
From the dropdown at the top, we can go through to details to take a look at the full Waterfall view, which shows the order all requests were made and processed. This can be great if we are looking for anything which may be render-blocking, for example.
We can also view the Web Vitals tab for an overview of how the page performed against each of the Core Web Vitals metrics.
Alternatively, from the summary tab, we can navigate to Watch Video for a visualisation of page load in real time.
Clicking Watch Video will generate the video for us in-browser. Underneath the video we can find options to either download in video format or as an animated GIF.
As mentioned above, this can be a really useful tool when portraying the impact of layout shifts for the CLS Core Web Vital.
Balancing decisions
Further articles in this series will focus on the individual optimisations recommended by the Lighthouse audit and how to balance decisions around them. However, the key focus point when balancing decisions is cost vs benefit – and this is something that will differ for every business.
Although, in a perfect world, we’d love to tick off all of the optimisations Google recommends, this is not always feasible. We’ll be looking at some of the variables that need to be factored into this decision-making process to help identify when an optimisation option is an absolute must-have, and when it can be ignored. Keep an eye out for our next post: Optimising LCP Without Breaking Your Dev Budget


