Early testing of Google’s AI Mode
Google started rolling out AI Mode in the US on 20 May 2025, after announcing it at Google I/O. In typical Google fashion, a mix of curious screenshots has surfaced ranging from misinformation to completely random responses.
I’ve been focused on compiling and analysing as much data as possible from our early observations, aiming to understand the output and see how it correlates with traditional SEO metrics. We ran this first pass in June 2025, across 588 prompts in three sectors: travel, ecommerce, and SaaS.
The aim is to determine a repeatable way to approach AI Mode visibility and measurement. This covers what gets cited, how cited URLs compare against current metrics tracked, and what you can and can’t see in your own analytics.
It matters because, at the time of testing, Search Console blended AI Mode clicks and impressions into its wider Google Search reporting.
We’ve drawn this data from a large sample size, though it does come with its own set of limitations and biases. I’ve tried to break down the methodology as clearly as possible and highlight the specific challenges we encountered while bringing the data together.
This is a correlational study that describes the profile of URLs that AI Mode cited. It doesn’t cover the factors that caused their citation and reports patterns, not ranking factors.
TL;DR
- Sequential prompts generated more cited URLs than independent prompts, and 94.1% returned a different top three results.
- Cited URLs showed different average profiles on traditional SEO metrics across travel, ecommerce, and SaaS (descriptive averages, not proven inclusion thresholds).
- AI Mode responses were semantically similar to AI Overviews on our prompt set (cosine similarity of 0.84).
- Only 57% of cited URLs (1,806 of 3,132) carried the #:~:text= fragment that helps identify AI-referred visits.
- AI Mode included shopping links without directly stating “Shopping” as a source.
- Some shopping result pages took 30 seconds to load compared to the usual 5 to 10 seconds.
- Shopping links included product details and identifiers (e.g., productDocid, catalogid, headlineOfferDocid).
Methodology
We analysed a sample of 588 prompts and question-style keywords across travel, ecommerce, and SaaS sectors. These were tested in two ways:
- Standalone AI Mode chats with each prompt started in a new session.
- Part of a sequential flow based on thematic clusters. For instance, if the queries focused on New York, they were kept within the same conversational sequence before moving to a new topic cluster.
Limitations
Due to the scale of testing, we encountered request limits that required changes to IP addresses at intervals. This was typically necessary every 50 to 60 prompts.
Personal context is another limit, which Google previewed at I/O, but it wasn’t active during our testing. The same prompt doesn’t always return the same citations, as AI Mode responses can vary between sessions.
All SEO metrics are also third-party estimates from Ahrefs. We report mean averages, which a few very strong or weak URLs can pull up or down.
No baseline is a big gap, too. We only looked at URLs AI Mode cited, so we can’t say if they differ from pages in the organic SERPs top 10 for the same prompts. These averages describe AI Mode’s sources, but not what it prefers.
Measuring against traditional SEO metrics
As we continue transitioning from traditional SEO metrics to those more aligned with AI-driven search and large language models (LLMs), we’ve been analysing how Google selects and cites sources in AI Mode.
To support this, we’ve reviewed 3,132 result URLs as part of an ongoing observational study, from 588 prompts.
We’ve broken down results by sector (travel, SaaS, and ecommerce), which helped identify subtle variations. We already audit AI and organic visibility for clients across these industries via our travel SEO, SaaS SEO, and ecommerce SEO work. It’s worth noting this is early data and findings may differ with broader sampling.
Our analysis focused on four key metrics:
- Domain rating
- Number of referring links to the specific URL
- Estimated number of keywords the URL ranks for on Google
- Estimated monthly organic traffic.
All data was sourced from Ahrefs.
Domain rating
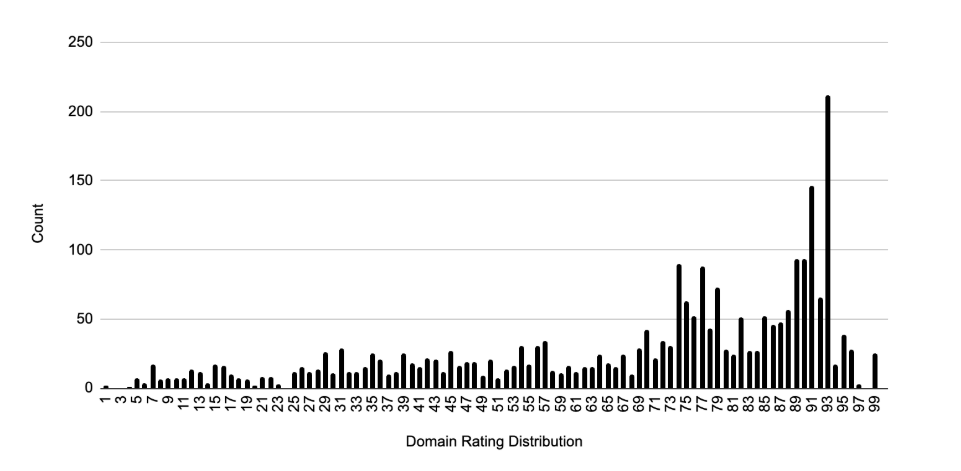
Domain ratings varied across the sectors. URLs cited in response to travel-related prompts had an average domain rating of 67.28. Our travel sector AI visibility data study provides a useful comparison.
Ecommerce prompts averaged 62.08, while SaaS and tech-related queries saw the highest average at 73.96. As expected, there’s a wide range in the data, so we’re working with mean averages for a clearer picture.
The graph visualises how often URLs fall within different domain rating ranges, highlighting the distribution across sectors and giving a sense of the spread and consistency observed.
Referring domains
Using the same three sectors and specific URLs from each prompt, we also looked at the number of referring domains per URL.
For ecommerce prompts, the average number of referring domains was 22.
This rose to 35 for travel-related URLs, and climbed further to 88 in the SaaS and technology space. This may reflect the generally stronger backlink profiles often seen in more technical or industry-focused content.
Traditional organic keyword visibility
We also analysed the cited URLs based on how many global keywords were visible in Google search.
Just as we’ve done with links and domain rating, this helped highlight the differences between the categories we examined.
On average, travel URLs ranked in traditional search for about 471 queries. That figure rose to 648 for SaaS-related URLs and then jumped for ecommerce, which averaged around 1,616 traditional search queries per URL. Across the entire dataset, an average of 911 keywords ranked per cited URL.
Traditional organic traffic
In the sample of AI Mode results we analysed, the average estimated organic traffic to each URL was 3,030 a month.
Breaking this down across three sectors, travel had the lowest average traffic per URL at 1,995. This increased to 2,817 in the SaaS and technology sector, and rose even further in ecommerce, where the average traffic per URL reached 3,480.
Reading the four metrics together
Each metric tells a simple story on its own. Side by side, they show three different source profiles.
| Sector | Avg domain rating | Avg referring domains | Avg ranking keywords | Avg est. monthly traffic |
| Travel | 67.28 | 35 | 471 | 1,995 |
| Ecommerce | 62.08 | 22 | 1,616 | 3,480 |
| SaaS and tech | 73.96 | 88 | 648 | 2,817 |
| All cited URLs | – | – | 911 | 3,030 |
Cited URLs for ecommerce had the lowest average domain rating and the fewest referring domains, yet the biggest keyword footprints and the most traffic. That makes it an outlier and suggests AI Mode reaches for pages with broad, proven demand rather than authority. That fits with category and product-style pages that often rank for hundreds of variations of the same query.
SaaS tells the opposite story. Cited URLs came from the strongest domains, with an average of four times as many referring domains as ecommerce, but a smaller keyword footprint. Authority holds more weight, which suits a sector where documentation, reviews, and comparison content on high-DR sites carry much of the answer.
Travel cited URLs had the smallest keyword footprints and the least traffic, despite mid-range authority. That could be because travel prompts, like looking for recommendations in a specific neighbourhood, pull in more specialised, long-tail pages.
These are initial hypotheses, which require additional testing and classifying cited URLs by page type.
Independent versus sequential prompts
A key part of LLM-driven discovery is the emphasis on users engaging in sequential prompt conversations with these models.
In the past, I’ve described a similar trend in more traditional search behaviours, which I referred to as “query stacking” or early-stage exploratory searches. At SALT, rather than focus on one-off prompts, we use query stacking to review AI search: early-stage, vocabulary-building searches become sequential prompt flows in AI Mode.
What’s new with LLMs is the nature of the interaction. Users often begin with a vague or open-ended prompt. Then they develop it further, reshaping or refining the query based on what they learn or what feels more aligned with their intent.
This reflects a deeply human approach to exploration. It’s less about immediately finding the perfect prompt and more about evolving understanding through a back-and-forth exchange. That’s where LLMs differ significantly: there is a clear distinction between issuing isolated, one-off prompts and engaging in a sequential, adaptive prompting flow allowing for deeper discovery.
What is query stacking?
Query stacking is closely linked to early-stage searches, where users lack the right vocabulary or context to form precise queries. Instead of finding what they need with a single search, they build a series of queries, each shaped by what they’ve just learned. This iterative process helps refine their understanding and move closer to their goal.
It’s especially common when people are new to a topic and start with broad searches. As they gather more information, their queries become more targeted. Google’s I/O announcements in May 2025 added weight to personal context, with AI Mode set to draw on past searches and even optionally connect apps such as Gmail. That makes this kind of search behaviour even more important.
Though personal context wasn’t active during our recent testing, we examined how AI Mode handles both standalone and sequential queries.
Comparing the two helped us explore how stacking affects the quality and depth of responses. It also builds on our thinking about grounding vs fan-out queries, where context carries through a conversation and shapes the sources pulled in. It points to a shift in how users interact with search: less about isolated intent, more about evolving through ongoing dialogue.
| Sector | Avg. Citations – Independent | Avg. Citations – Sequential |
| Travel | 9 | 10 |
| SaaS | 11 | 15 |
| Ecommerce | 9 | 13 |
More citations (on average) were present for sequential prompts. The top three visible citations on result load also differed substantially, with 94.1% returning different results or result orders, compared to independent searches.
That shows how testing a single prompt in isolation provides an incomplete view of AI Mode visibility. Audiences research in sequences, so your monitoring should too.
Google’s query fan-out technique (breaking a question into subtopics and running many searches simultaneously) could explain this. In a sequence, each new prompt arrives with the context of the ones before it, so there’s more to fan out across, and more sources to cite.
Output comparison against AI Overviews
We’ve been living with AI Overviews for more than a year now, and experiencing the impact on clicks/organic traffic across multiple sectors. This led me to look at the output differences between AI Mode and AI Overviews across the 588 prompts. This compares answer content, not traffic impact.
To measure similarity, I’ve used a BERT-based text comparison.
Why use BERT?
Traditional text comparison relied on methods like TF-IDF or word overlap. These can capture surface-level similarity but often fail when the same idea is expressed with different wording.
BERT and its derivatives changed that. These models understand context, allowing them to generate embeddings (vector representations) reflecting what a sentence or paragraph actually means.
I ran this in a Colab Notebook, using all-MiniLM-L6-v2.
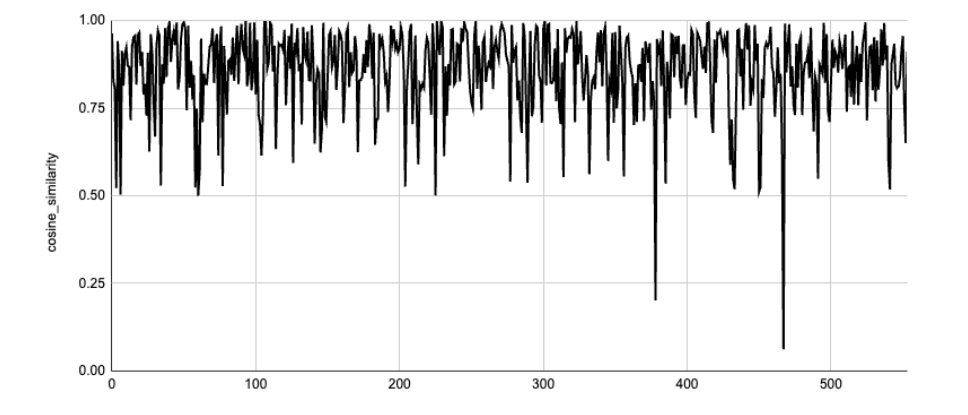
In our study, the resulting cosine similarity score was 0.84.
This is considered high semantic similarity, indicating both texts conveyed largely the same information even though their wording and structure differed.
A score like 0.84 suggests the two texts (AI Mode v AI Overview) could serve similar user intent or use cases on this prompt set. The two surfaces aren’t interchangeable for every query, and an embedding score measures meaning, not citations, layout, or shopping behaviour, which can still differ.
Tracking traffic from AI Mode
One partial method of tracking traffic to your site from AI Overviews, and AI Mode, is the #:~:text= (hashtag colon tilde colon text equals) element in some referring URLs.
This isn’t foolproof. Our testing with AI Overviews shows not all citations include this fragment. The same is true for AI Mode. We found 1,806 of the cited URLs contained this URL fragment (57% of the 3,132), meaning under half of URLs cited (43%) don’t contain a distinguishing fragment for Analytics or Search Console to pick up.
Treat text-fragment referrals as a useful signal rather than a complete count. Use them alongside broader LLM referral tracking and review what those sessions do on your site. Start with our analysis of LLM click-through intent.
Knowing what the fragment can’t tell you is also useful. AI Overviews use it too, so a text fragment shows that a visit came from one of Google’s AI features, but not which one.
Conclusion
AI Mode is still in its early stages. However, our initial observations indicate three clear patterns:
- Context changes what gets cited
- Cited URLs have distinct metric profiles by sector
- A large share of AI Mode clicks can’t be reliably attributed.
From citation frequency to domain strength and traffic potential, cited URLs in this sample often showed familiar authority and demand profiles. That suggests overlap with traditional SEO signals, but doesn’t make domain rating, links, keywords, or traffic proven AI Mode ranking factors.
The differences between independent and sequential prompts show just how important query context has become, both in terms of response depth and source selection.
We are seeing strong similarities between AI Mode and AI Overviews in what the answers say. It’s still worth monitoring AI Mode independently, though. Its citation mix, sequential context, shopping behaviour, and how traffic shows up in analytics can all diverge from AI Overviews, even when the answer text is similar.
The next questions to answer are how cited URLs compare with the organic top 10 for the same prompts, which page types AI Mode favours in each sector, and how much personal context changes the picture once it’s switched on.
This is just the beginning. For now, three things are worth doing:
- Segment text-fragment referrals in your analytics
- Test priority topics as prompt sequences rather than single queries
- Track AI Mode citations separately from AI Overviews
We’ll keep building on this dataset as AI Mode – and the reporting around it – matures.


