Web Vitals: Field Data v Lab Data
Google has announced that page experience is going to be a ranking factor that they are going to be implementing next year.
Now, we all knew that user experience is critical for users to stay happy when they’re on your web page and to make sure that they end up achieving the purpose that they are there for, and this confirmation is a further step.
But what does that mean for you as a website owner or webmaster? The first kind of significant change that we’ve seen recently is called Web Vitals and is now a feature under the enhancements section of Google Search Console.
If you are yet unfamiliar with what Web Vitals are, you can check out this guide on using them.
Google themselves have also produced many great articles explaining what three new metrics (Largest Contentful Paint (LCP), First Input Delay (FID), and Cumulative Layout Shift (CLS) are, and what to look out for on websites visually.
However, ever since CRUX data was introduced in Dev Tools (namely through audits) a large number of users have flocked to various forums, including the Google Webmaster Forum, to verify the differences between the data being provided in Lighthouse reports, and now in Google Search Console.
Namely, the stark differences between CRUX field data and CRUX lab data.
What is field data?
Field data isn’t a new report; it represents the anonymised data of how your website has performed for users in the real-world.
This is aggregated performance data taken from multiple users across multiple devices, locations, and network connections.
Defined by Google’s PageSpeed Insights documentation:
When PSI [PageSpeed Insights] is given a URL, it will look it up in the Chrome User Experience Report (CrUX) dataset. If available, PSI reports the First Contentful Paint (FCP), First Input Delay (FID), Largest Contentful Paint (LCP), and Cumulative Layout Shift (CLS) metric data for the origin and potentially the specific page URL.
What is lab data?
Lab data is theoretical load data, based on a simulated load of a webpage on a single device and a fixed set of network conditions.
Which one should I trust?
Both of these scores are important because if Google is recorded poor scores from a lab environment, you have issues – but just because they are zero and the field data isn’t, it doesn’t mean you’re in the clear.
The below example will be common for a large number of websites:
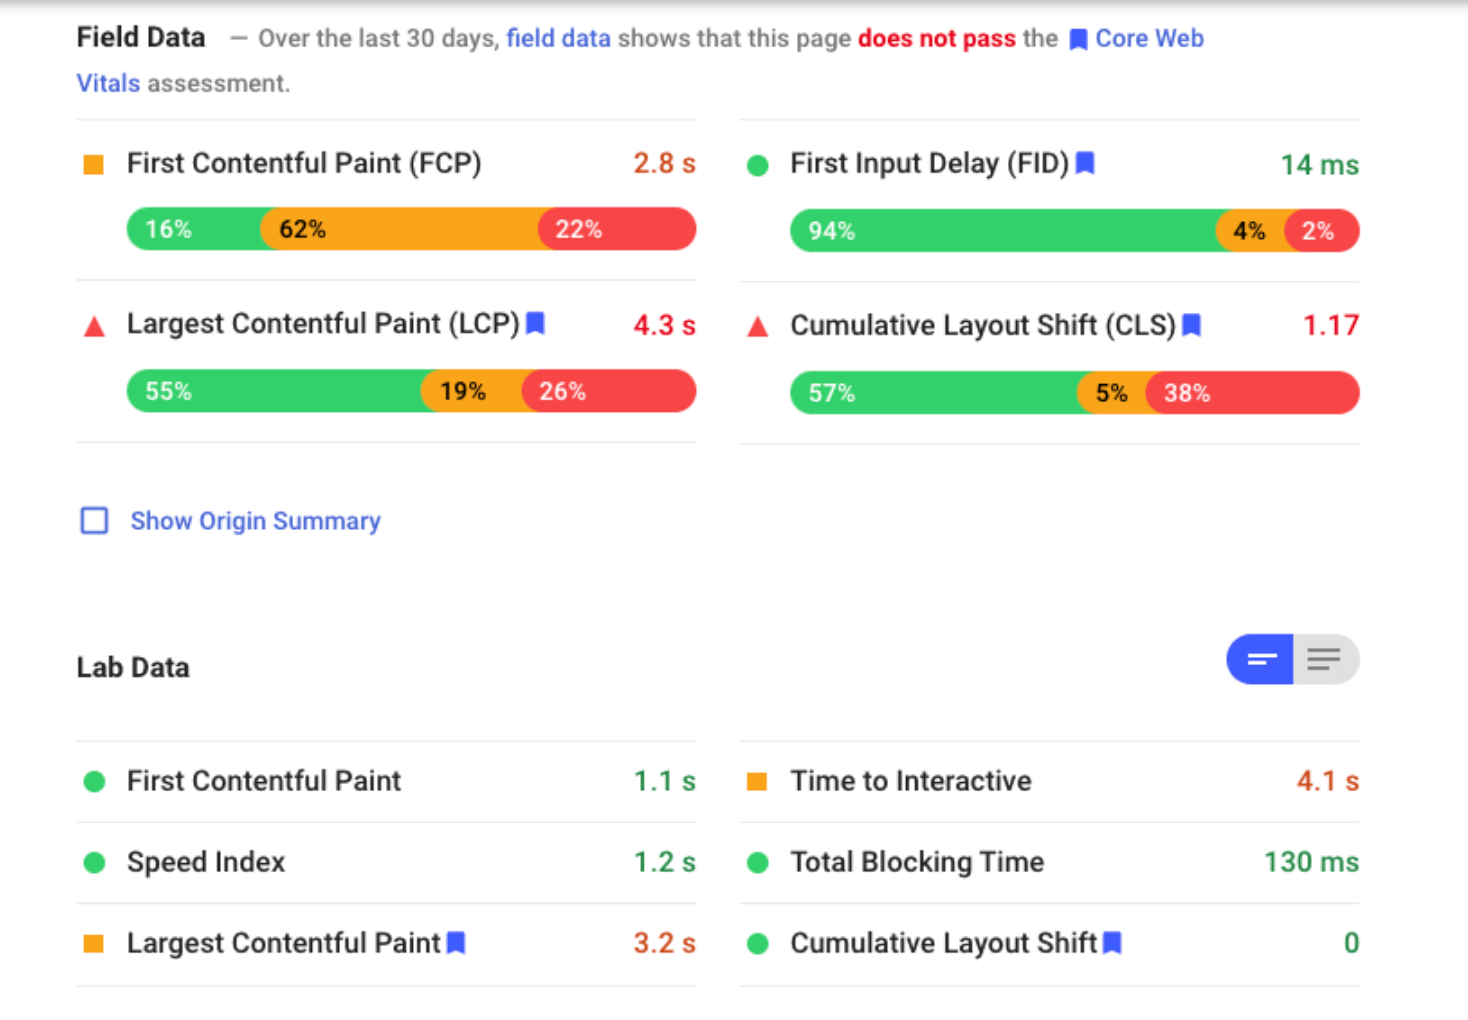
The story behind these numbers is that while in Google’s lab environment it is experiencing minimal CLS (cumulative layout shift), 38% of your users are potentially experiencing such negative experiences it nulls the possibility of conversion.
By working with your developers, design team, and understanding on a template level where this is happening, the above example could create a better experience for 4 in 10 users, which is important given that the competition for organic traffic has never been greater. You want to maximise the experience of your users to stand a better chance of them converting, purchasing, or clicking on affiliate links.


