Introducing Web Vitals: A guide to using and visualising their data
When it comes to search engine rankings, page speed is one of the most important and also most neglected factors.
This is simply because even with the best content, if the user cannot load a page fast enough, they will simply leave.
This will, in return, increase the percentage of short clicks based on the “short clicks v long clicks” algorithms.
To reduce bad experiences, Google tries to model the user experience when it comes to measurable web performance.
This is, however, easier said than done.
To succeed, Google needs to run real-world and lab measurements to define what is a fast and enjoyable user experience.
Introduced in May 2020, Web Vitals, going forward, will be the essential metrics used to measure great user experiences on the web.
What are Core Web Vitals?
According to Martin Splitt on VirtuaCon Live 2.0 on the first iteration, Google has decided to use the three metrics called “Core Web Vitals”.
These facets are the Largest Contentful Paint (LCP), First Input Delay (FID), and Cumulative Layout Shift (CLS) for the standard measurements.
Having said that, they may change on a yearly basis. Let’s try explaining what each of these is.
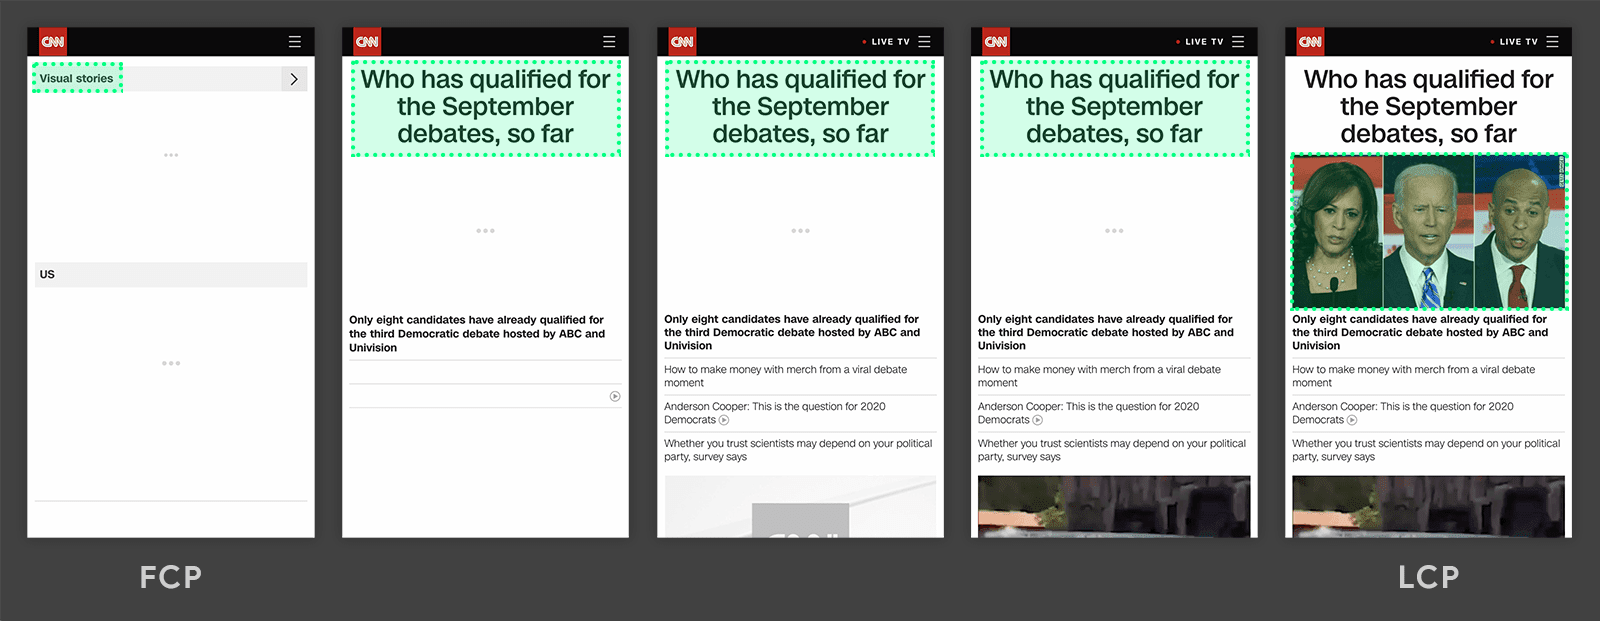
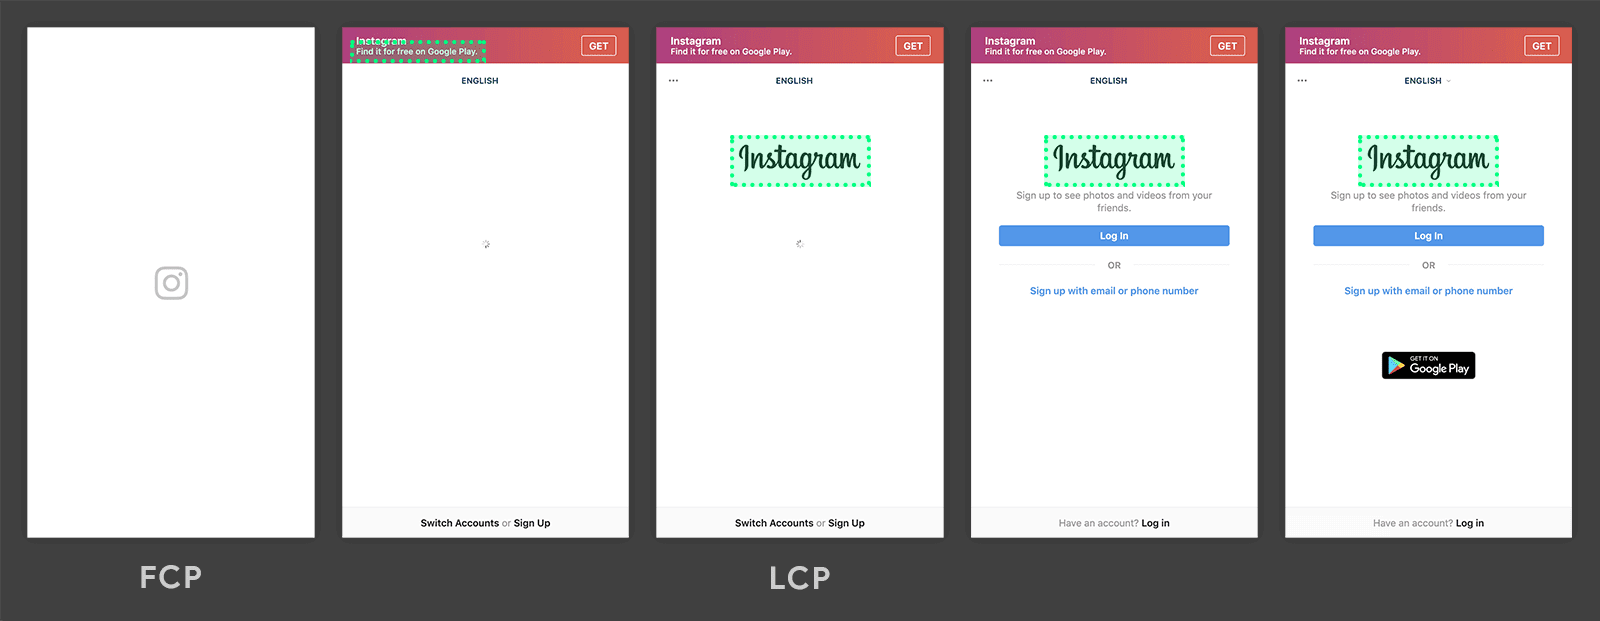
What is LCP in Web Vitals?
LCP is a metric that tries to measure when a website is basically visible to the user and shows the largest content element visible within the user’s viewport.
This does not mean that the website is fully loaded. Below are examples of websites showing different LCPs:
What is FID in Web Vitals?
Some websites paint content very quickly. For example, let’s use a contact form page.
If nothing happens for five seconds and then you can fill in the form, that interaction should be considered slow. FID measures the time it takes for the first meaningful user interaction.
It’s worth noting that any user input, including scrolling, is considered as user input.

What is CLS in Web Vitals?
CLS is the measurement of unexpected movements on a page.
This is my favourite, especially for mobile pages. CLS measures how much things move unexpectedly after they settle in.
For example, this could be the appearance of banner at the top of the page pushing down content while you are trying to read or click on something.
The video below perfectly shows this issue. Notice the pro-tip banner popping up right through the user journey.
How can you collect Web Vitals and use them?
The best thing about Web Vitals is that you can personally collect them through Google’s script without affecting your website’s performance.
This way, you can make a data-driven decision by looking at a large data set rather than just a site speed tool that runs one from a personal machine or an individual server.
The Web Vitals script can be integrated into your website/app in many ways as described within the appropriate Github page. I highly recommend that you incorporate it within your build.
You may, however, simply want to run a trial, and quickly digest the data through Google Analytics.
Push Web Vital data to Google Analytics
If you want a simple way to load Web Vitals from CDN and then push the code onto GA then here we go; a simple two-part code that should load on pages (all site suggested) that you want to monitor.
This code then pushes the data in the form of events into your GA.
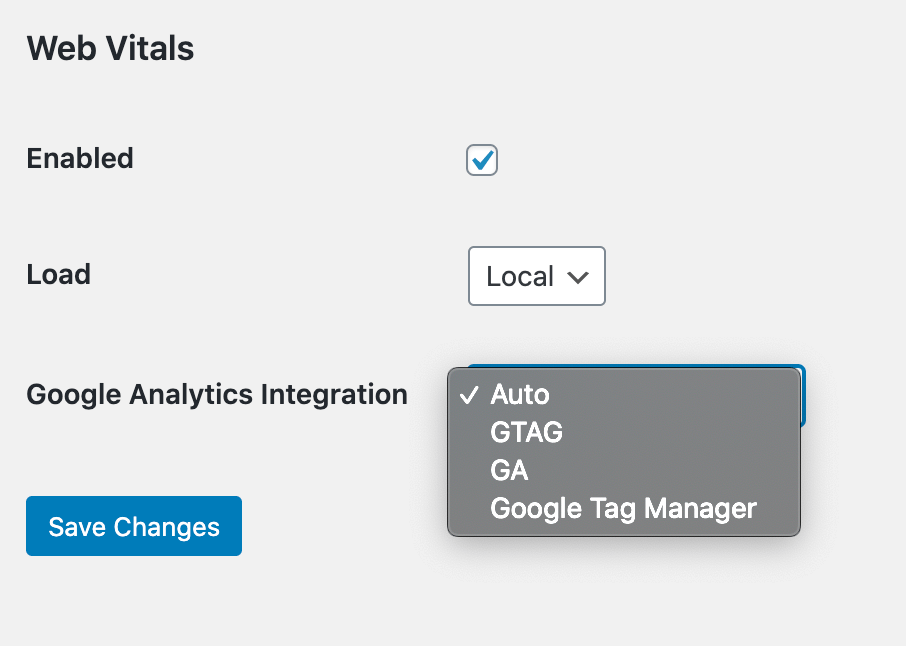
Web Vitals WordPress plugin
For ease of installation, we’ve also made a Web Vitals WordPress plugin. This plugin works not just for GA but also GTM.
You can easily install it through the plugin manager, or alternatively, if you would like more control, you can find the source code available on Github.
What can you learn from Web Vitals
Once you’ve pushed your events into Web Vitals, you can use the data to understand a variety of information based on a large data set of users in multiple locations and on different browsers — rather than just based it on a smaller sample.
Web Vitals and the Google Analytics Dashboard
To get started, we’ve shared a basic GA Dashboard that will display your information to make it more useful. To install the dashboard on your GA profile, please click on the link below.
- Basic Web Vitals GA Dashboard V 0.1 – Don’t worry, this is just a template. We can’t access your data.
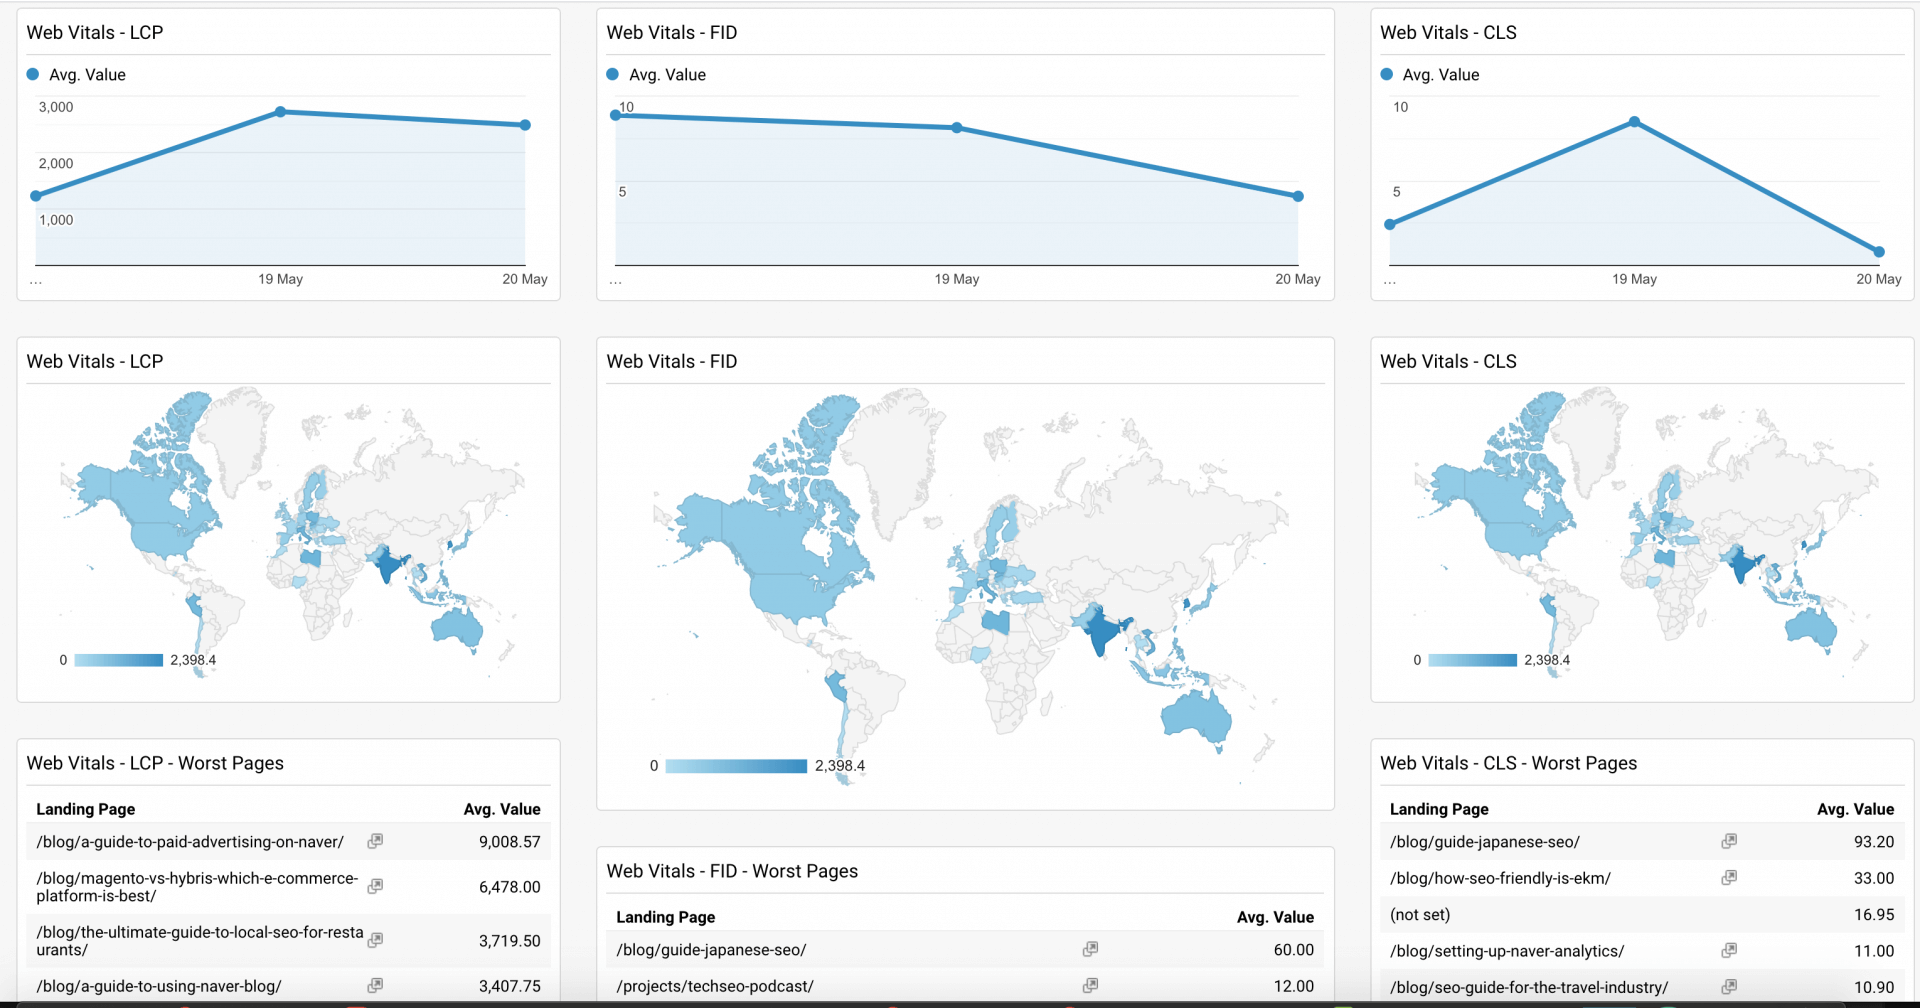
Our basic Web Vitals GA dashboard allows you to see the three different metrics in multiple formats that are digestible when a larger date range is set.
Everyday average web vital metric
The daily moving average allows you to monitor for spikes. It is generally good to monitor spikes when large updates happen to the website, and you want to make sure you haven’t seriously affected your performance
Average web vital metric by region
This allows you to monitor the metrics by country and region. This is especially useful for CLS, where you could be displaying different content to each region.
For example, Europe might see cookie banners and suffer from worsened CLS due to bad implementation, and this would then allow you to see that. The darker the country, the more affected it is.
Page average web vital metric
The page average web vital value allows you to see the worst affected pages for each value, which then allows you to dig in and find out what could be causing issues, if any at all.
More web vital ideas for dashboard and reporting:
I suggest that these basic dashboards are expanded onto Google Data Studios, to allow you to explore the data further.
For example, you can use the Data Studios data explorer to dig into each page and look into types of browsers and countries.
We will try to update the dashboard as time passes and the data becomes more useful to display.
How to install Web Vitals through GTM?
Sadly, we do not recommend installing web vitals through GTM as the data collection will be more unreliable than expected.
You can, however, install Web Vitals on the code base and then push in the data through GTM to your favourite analytics platform.
You can see a list of different ways of doing this on the GitHub source code.
Can I see my Web Vital information without having to install anything?
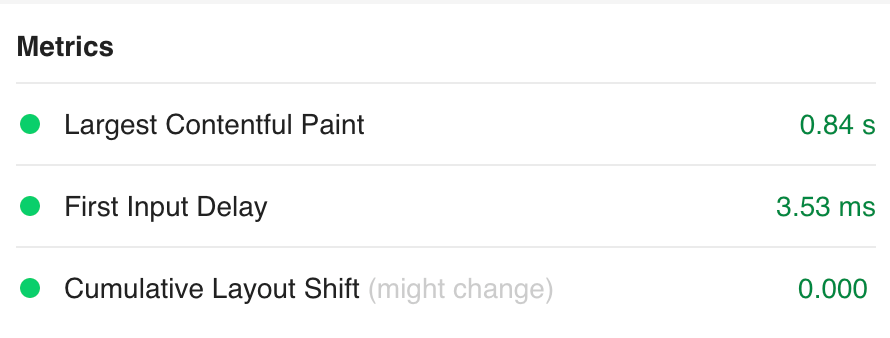
Of course, you can see it either through Chrome Developer Tools or by installing the Web Vitals Chrome plugin!
Once installed, you’ll see a square icon that will flash red or green depending on your Web Vital Score.
Try it your self by going to Web Vitals Chrome’s Extention.
Frame images & videos from Web.dev by Google:


