An SEO analysis of the US homeware industry
Our analysis of the homeware industry over the last three years has identified significant search demand volatility.
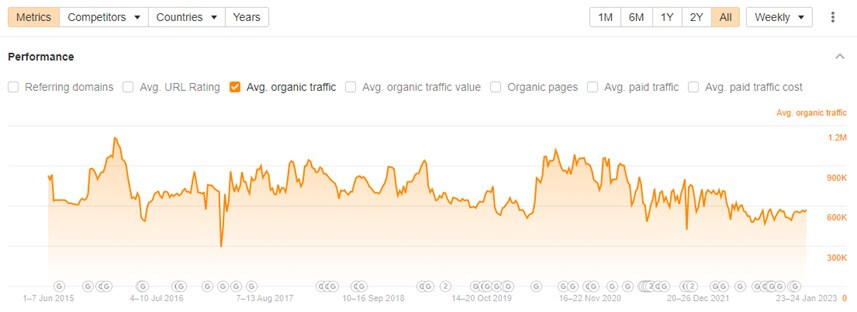
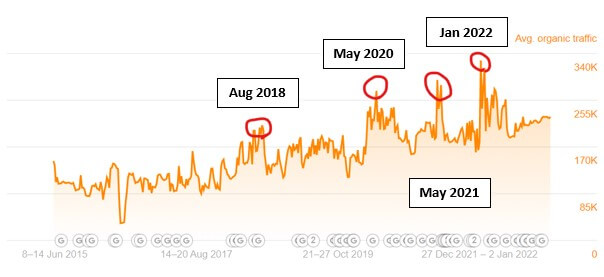
Major macroeconomic events have had dual effects on the market. The pandemic has played a large role in increasing demand for homeware while also causing supply chain issues. Due to the growing size of the homeware industry, it requires global manufacturing from countries such as China, Sweden, Germany, and Poland. Trends like this are clearly evident in organic search volumes, shown below.
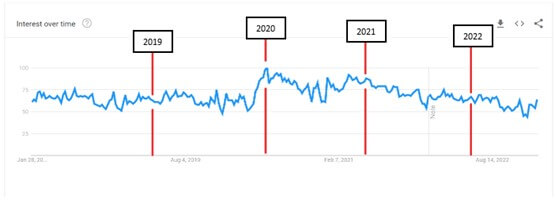
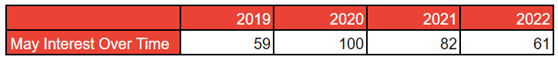
The chart and table above show that the pandemic caused a surge in organic traffic. The increase in people staying at home resulted in increased interest in home improvements and adapting to working from home. The shift to remote working is apparent in the increase in search volume for “home office”, “office chair”, and “working from home” during the pandemic. These are responsible for the homeware industry reaching record high search volumes.
The industry-wide search volume was not sustained and was followed by a subsequent decrease to its lowest level of search demand in December 2022. The decline correlates with the timing of covid shipping restrictions, a dampening economy and rising cost of living, and global conflict. These macroeconomic issues are having a lasting effect on the market.
The homeware industry has varied distribution channels. These can be categorised into specialist stores, online stores, and department stores. Only one type of store could operate during the pandemic — online stores. This provided opportunities for the players in the industry using this channel.
Let’s analyse some of the leading competitors in the industry from an SEO perspective.
All competitors
We will highlight the organic search behaviours of the following competitors:
- Raymour Flanigan
- The Spruce
- Wayfair
- Serena and Lily
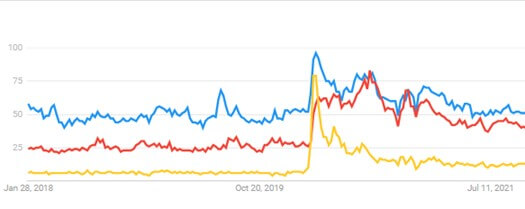
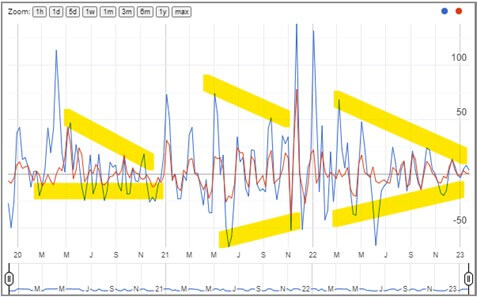
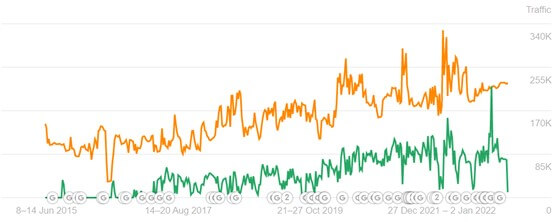
Using the third-party tools — Ahrefs and Google Trends data — we can compare the cumulative month-on-month organic traffic growth to the cumulative month-on-month interest-over-time.
Evidence shows both organic traffic and search volume have decreased since the start of 2022. Due to the consistent market trend in recent years of recurring growth following a decline, you would anticipate a similar result. However, we are seeing stagnant growth in the final month of Q1.
As this trend of performance and search volume decline occurs among all competitors, it’s evident the impact is a result of market changes, instead of a technical SEO issue. As previously mentioned, this is likely because of macroeconomic activity. Being an external factor we are unable to control, we should consider market changes, but limit its influence on SEO strategy.
When considering the economic environment in a marketing strategy, there are always two arguments to make. The first is to decrease budgets due to lower consumer purchasing power. The second is increasing budgets to gain a competitive advantage while marketing budgets decline amongst competitors. The latter appears to be the better option for long-term SEO success, as organic channels are an investment and provide a competitive moat, helping entrench themselves in the market.
We can use an internal tool to compare organic traffic performance before and after an algorithm roll-out, while considering the industry’s seasonality. Using the weighted average of these competitors, we can assess which algorithms had the most significant impact on performance across a collection of competitors.

Product review updates were two of the most impactful algorithm changes. There were four product review updates in the period we analysed, and each negatively affected performance, ranging from a -20.1% to -145% percentage change. Consequently, implementing product review recommendations into their SEO strategy will likely give them an edge over competitors.
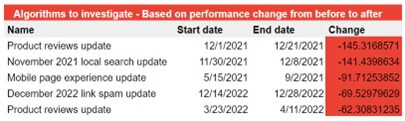
The algorithm update that had the most positive impact was the desktop page experience update. In comparison, the update with the most negative impact was the mobile page experience update.
Using page speed insights, we can take a more granular look at each competitor’s page experience performance. Page Speed Insights uses a slow 4g connection to test the Core Web Vitals (CWV) of a webpage. This is called simulated data. Core web vitals are Google’s way of quantifying user experience using six different metrics.
Using four different webpage templates to create an average score, the table below compares the mobile and desktop performance scores for each competitor.
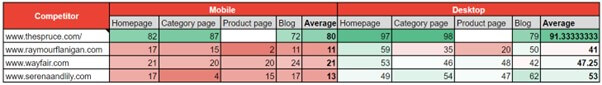
Throughout the collection, we can see a clear divide between web and mobile performance. A company that can optimise its website for mobile performance will have a clear advantage over the competition.
The only exception is The Spruce, due to it being a blog website. Reducing back-end code improves web and mobile performance, but there is a notable difference between mobile and web performance. Using the tool previously mentioned, we can compare The Spruce to the whole collection of competitors.
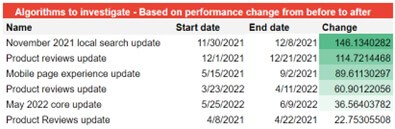
The Spruce benefited from the mobile page experience update and the product review update while others suffered. Competitors can take this as a demonstration in the importance of both page experience algorithm updates.
Implementing the correct actions for these updates can potentially lead to a 20 to 114 percent improvement in organic traffic performance over the collection of competitors. There are more factors to consider before determining causation, as SEO is a highly complex and expansive topic. However, the correlation is clear.
Raymour Flanigan
Raymour Flanigan is a furniture retailer founded in New York. The company boasts more than 130 physical locations and offers a broad range of indoor and outdoor furniture.
Raymour Flanigan prides itself in delivering exceptional customer service, supporting the local community, and recycling. Targeting the low to mid-price range market, Raymour Flanigan has established itself as a household name with significant market share.
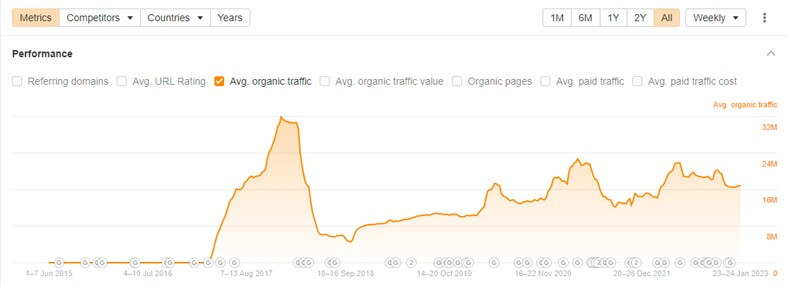
We can analyse Raymour Flanigan’s average organic traffic by using Ahrefs.
As expected, there was an increase in average organic traffic during the peak of the pandemic. Having an online store had clear short-term benefits, but also significant long-term advantages. Referring to the analysis in the introduction the industry has a few methods of distribution — specialist stores, online stores, and department stores.
The lack of access to specialist stores and department stores during the pandemic forced consumers to shop online, which restructured the market. This allowed online stores to capture more market share, improving retargeting, reselling capabilities following the pandemic, and reduced purchase anxiety for consumers who resisted making high-ticket purchases online.
Taking a broad look at the chart above, average organic traffic is clearly trending down. Both referring domains and organic pages increased during this time, suggesting there is a technical issue. An eCommerce website with 20,000 pages presents a range of technical SEO challenges. Since the launch of the website in 1997, SEO has drastically evolved, and implementing the necessary changes to the website wasn’t a priority for Raymour Flanigan.
The decrease in organic traffic is due to a drop in ranking. There were more than 6,000 1-3 ranking keywords and 18,000 4-10 ranking keywords in February 2016. In January 2023, there were 2,400 1-3 ranking keywords and 5,000 4-10 ranking keywords. However, the reason behind this is unclear.
The Spruce
The Spruce differs from its competitors in that the site is primarily a blog that offers a small selection of lower-priced products.
Boasting 385 million annual visits, The Spruce knows how to generate organic traffic.
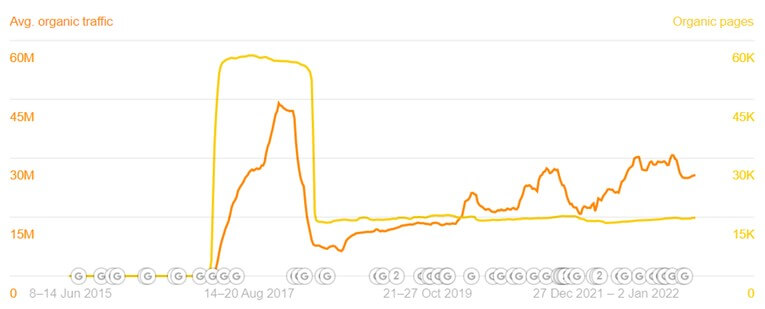
The Spruce’s origins are a blogging website, which is why, in 2017, their website neared 60,000 pages, resulting in average organic traffic highs of 44 million, followed by a sudden decrease in organic traffic.
Using Google News, there aren’t any notable mentions of The Spruce, so it’s unlikely there were external factors influencing traffic drop. It could be due to a change in strategy, but competitors within the industry also experienced a decrease in organic traffic and organic pages. This presents more questions.
Traffic has steadily grown since the unexpected drop, but is yet to return to previous highs. There has been minimal growth in the number of organic pages, but we can see an increase in referring domains. Given that referring domains are a direct ranking factor, this contributed significantly to organic traffic growth.
Due to current SEO trends, such as AI-generated content, which focus’ on production quantity, good SEOs are focusing on content quality. This appears to be the strategy The Spruce has taken. Content quality can be improved in several ways — using primary data or regularly updating the content are common strategies. Both of which align with Google’s goal to improve user experience.
Wayfair
In 2023, Wayfair is still led by its founder 21 years after it began, serving 22.6 million customers and generating $12.4 billion in revenue per year. Operating solely online, Wayfair is one of the world’s largest home retailers.
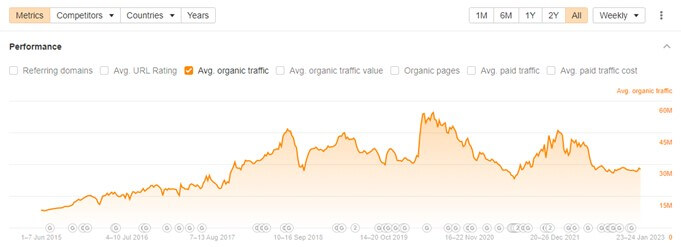
Wayfair has shown gradual long-term growth, with consistent increases of organic traffic and industry-wide trends.
Its organic traffic peaked in June 2020, followed by a 31.4 million drop in average organic traffic. This high coincided with a similar peak in search volumes, but the subsequent decrease in traffic differs from the market trend, reaching the lowest average organic traffic since October 2017. It essentially follows the market trend but reacts much more aggressively.
One other notable point is the growth of Wayfair’s organic traffic since 2015. Due to data restrictions, we can only see after 2015. But we can use Google Trends to see the search trend for the branded term, “Wayfair”.
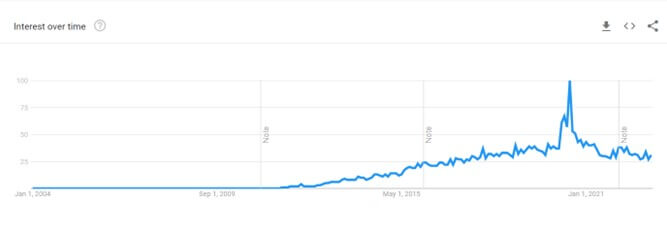
The growth shown in the chart above suggests a shift in marketing strategy to focus on SEO. We can see the continuous growth of organic pages and referring domains since 2015, supporting this assumption.
Many companies recognise consumers are becoming more intelligent with their purchasing decisions by using Google to compare prices and check reviews. Therefore, introducing SEO into their marketing strategy, not only as a lead generation strategy but as a branding strategy, is an intelligent decision. Appearing at the top of SERP 1 on Google helps position the company as a market leader through brand association with google.
Serena and Lily
Serena and Lily take pride in their Californian-style products to make their customer’s homes a “welcoming oasis”. Targeting the high-price range, Serena and Lily offer luxury furniture, bedding, rugs, lighting, bathroom essentials, décor, and outdoor furniture.
While the average organic traffic increase suggests no short-term SEO practices are being employed, the seasonality of this growth is quite sporadic and doesn’t suggest a sustainable growth plan is in place.
One contributing factor to organic traffic is likely paid traffic. Paid traffic can have knock on effects, such as increasing organic traffic through branded search queries. Unlike others in this report, Serena and Lilly have consistently used paid media as a traffic source.
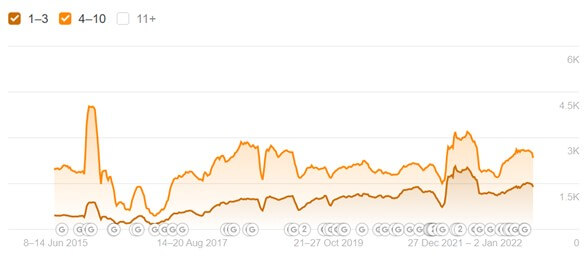
Looking at keyword ranking performance further implies Serena and Lily’s organic traffic performance correlates more with their paid media efforts. This is due to the lack of correlation between keyword rankings and organic traffic, two metrics that usually align.
What is notable is the continuous decrease in both 1-3 and 4-10 keyword rankings from June 2018 to August 2021. From this, we would assume average organic traffic would decrease, but it instead increases drastically.
One variable this does not consider is a decrease in the number of ranking keywords but a shift to target higher search volume queries. This is unlikely to be the case, as the homeware industry has a broad range of products, thus a significant amount of traffic comes from long-tail keywords.
Final thoughts
When analysing this industry, a few considerations need to be made. The first is the seasonality of the search volume. It’s essential to consider this so that performance changes can be appropriately diagnosed.
This is less of an influencing factor than macro-economic factors in the homeware industry. Looking at 2020, all competitors analysed in this report had a significant reaction to the pandemic. Similarly, all are currently seeing decreases in organic traffic. This is likely a result of a dampening economic environment, such as inflation.
Secondly, after analysing the impact of algorithms on the collection of competitors, we can conclude that the product review algorithms have had the most significant adverse effect on average organic search volumes.
Finally, for the majority of competitors in the collection analysed, the desktop page experience update had a positive effect, while the mobile page experience update had a negative effect.
Both algorithm updates present opportunities for companies to get a competitive advantage in an exceedingly competitive industry.
Using third-party data, we can compare rankings across various positions. Below is a table detailing the results.
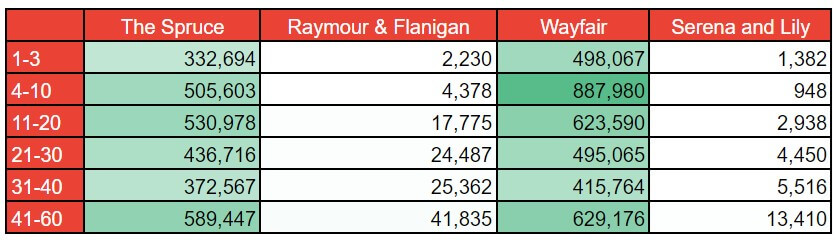
The Spruce and Wayfair perform significantly better than the other competitors. However, each has unique market positions, therefore, requires unique SEO strategies.


