Speed Analysis Of 165 Fashion & Clothing SFCC Storefronts
In March 2020, we analyzed more than 1,900 Salesforce Commerce Cloud websites for a number of common SEO issues and quirks.
You can read the original study here, and we will be updating this in 2022.
However, in this smaller study, we’re taking a look at fashion and apparel websites and how they perform in relation to site speed and Core Web Vitals.
Study Methodology
To perform this study, we’ve taken 165 Salesforce Commerce Cloud websites (active Storefronts) from various niches in the fashion sector, running B2C Commerce.
These range from fast fashion brands to sportswear and athleisure and vary in terms of the target audience (UK, US, Europe, and Asia).
We’ve then taken these websites and, using the PSI (PageSpeed Insights) API, collected the data first on scale through a third-party crawling tool, and then verified anomalies in the data once plotted on a graph.
We ran these API queries a total of three times on different days and at different times of the day in order to establish a mean and consistent set of results.
Lighthouse Performance Scores
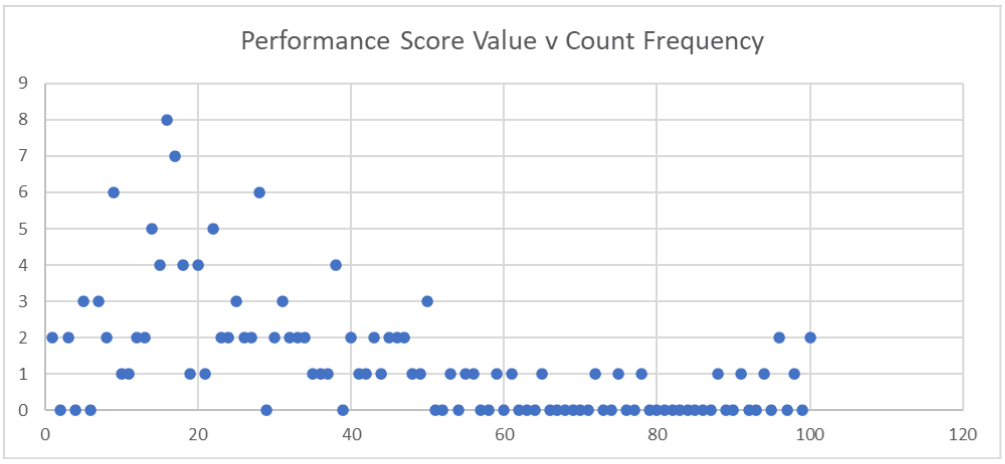
Out of the 165 Salesforce Commerce Cloud websites tested, 154 returned consistent results (at least 2 out of 3), and we’ve then taken the average scores.
When we plot the individual results for the 154 websites, you can see the general trend when it comes to Salesforce Commerce Cloud storefront performance.
Only two websites from the 154 achieved consistent scores of 100/100, with the mean score being 29 and the mode score being 9 (ten instances).
When we plot the number of websites per score (1-100), we can see the clustering that occurs in the sub-50 scoring range.
Obviously, these websites still rank and generate revenue, otherwise, the companies wouldn’t have made the investment in SFCC and developing a Storefront, so why does this matter?
Over the past two years, eCommerce has seen a lot of change in terms of how users interact and, in most cases, rely on online relationships.
For example, towards the end of 2020, due to users being forced online in most countries, we read headlines claiming the pandemic had “accelerated” the e-commerce adoption curve by 4-6 years. A year later, however, we’re reading headlines that for Black Friday and Cyber Week online shopping was down YoY versus 2019, with in-store shopping making a big comeback.
This change in user culture differed between different sectors, with vertical leaders having varying levels of success in retaining new customers.
The shift in user behaviour however has led to an increase in user expectations.
Reading through a number of feedback tickets submitted on various ecommerce clients, friction points have evolved from stock levels and unclear shipping to issues with loading elements, checkout processes, and the website seems “sluggish”.
Sluggishness can be very objective, and depends on the user’s device and internet connection – but it is something that we can also measure and monitor through SIT (Speed Index Time) and TTI (Time To Interactive), both measured in milliseconds.
Speed Index Time
The average Speed Index Time taken from the fashion and apparel sector data is 9,293ms (9.29 seconds), which is almost double the Lighthouse recommended time of 4.3 seconds.
When we plot these speeds against each other and against the recommended threshold, we see an immediate area of concern:
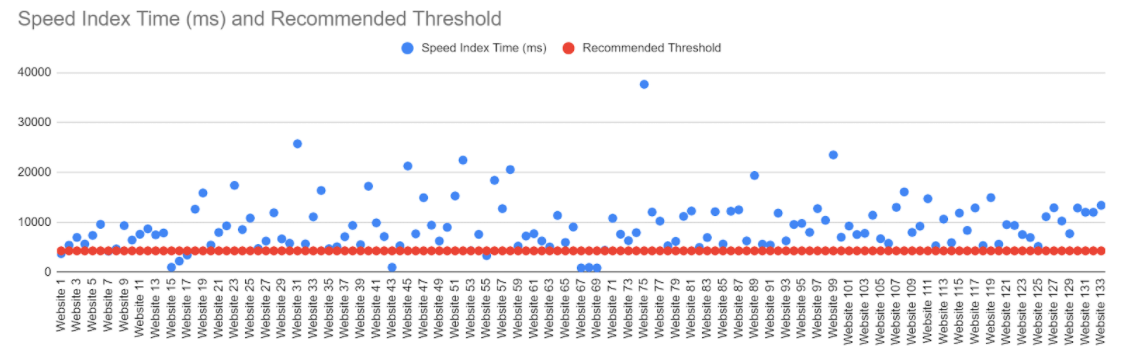
Only 10 websites returned (on average) a Speed Index Time lower than the recommended threshold.
Time To Interactive
Much like the Speed Index Time, the average TTI we take from the data set is 18.1 seconds, which is much higher than the 3.8 seconds that is set as a “good” benchmark by Google.
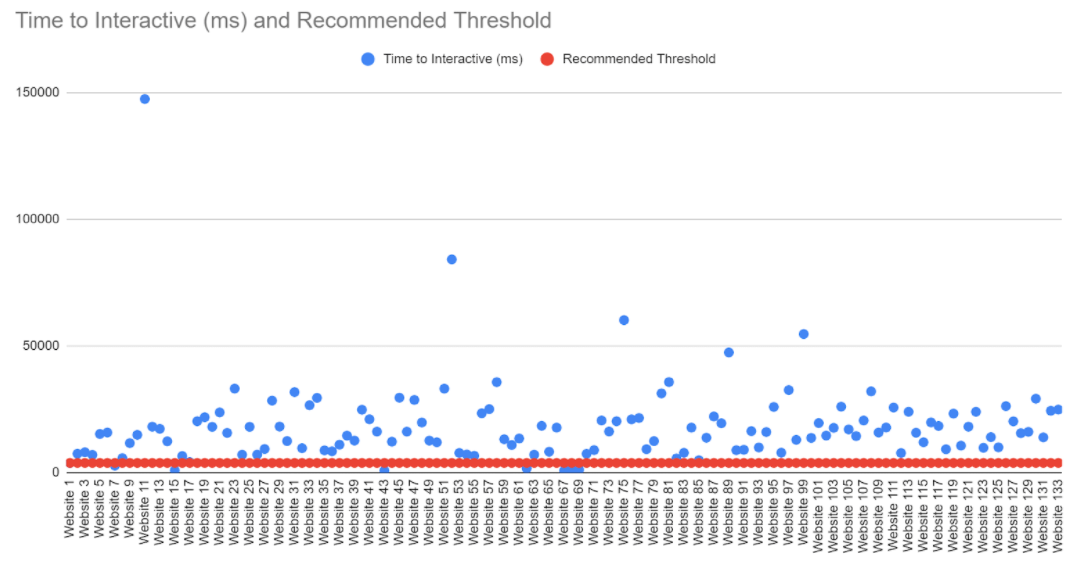
In fact, only 8 websites from the 165 tested have a TTI equal to or better than 3.8 seconds.
It’s worth noting that from the 10 websites achieving the recommended Speed Index, and the 8 websites achieving the recommended TTI, only 7 sites appear in both lists.
Salesforce Commerce Cloud Speed Issues
With most platforms, a lot of speed issues can be caused by how design and (some) functionality elements are implemented, and Salesforce B2C Commerce Cloud is no different.
And like most other platforms, Salesforce does come with some common speed issues that can be identified (and then resolved) across a number of different Storefronts.
These being:
- Image optimization opportunities
- Reducing and limiting the loading of unnecessary 3rd party scripts
- Dictating how and when 3rd party scripts load in the browser to optimize site usability
- Minimizing main thread work (where possible)
It’s also possible for a number of Storefronts to utilize SFRA (Storefront Reference Architecture) to alleviate some speed issues, as two great benefits of the SFRA framework.
These are the “adaptive design approach”, that has been shown to improve mobile load performance, and the fact that SFRA includes a number of pre-built integrations with the SFCC back-end, allowing them to outperform (in most cases) custom-built integrations.
If you are looking to improve your Salesforce Commerce Cloud performance or would like to know how your site compares to the ones in our study, please get in touch.


