Do users really show higher intent when they click through from an LLM to a website?
Over the past couple of months, I’ve seen a number of sources claim that traffic from large language models (LLMs) and AI platforms shows a “higher” intent than traditional organic search traffic.
I’ve not seen any data to support this, so I decided to gather my own. I crowdsourced from dozens of fantastic SEOs across Twitter, LinkedIn, and Slack communities. Based on their contributions, I’ve provided access to a custom Looker Studio dashboard and requested the following data over the first three months of 2025 (1 January to 31 March):
- Total sessions classified as LLM referrals.
- Total sessions classified as organic channel sessions.
- Total count of Key events triggered by LLM sessions.
- Total count of Key events triggered by organic channel sessions.
- The category/sector that the website operates in.
To show this visually, I’ve also coined the term “Key Event Conversion Rate” (KECVR) to distinguish between the KECVR of traditional organic search.
Increasing referral traffic from LLMs
Over the past year, LLMs have driven consistent referral traffic and provided an upward trend since March 2024, compared to the previous year’s average.
This increase reflects broader adoption of LLM tools and the frequent inclusion of links, both as citations and direct references. Despite this upward trend, there was an unexpected drop in December, which goes against the usual uptick seen during the holiday season.
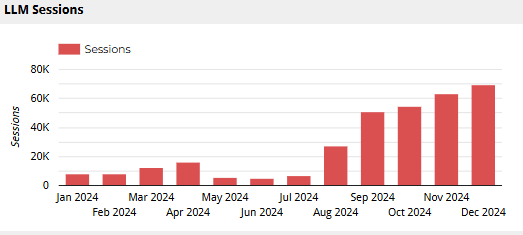
Looking closer at the data, ChatGPT has consistently driven the most referrals since August. This behaviour coincides with a shift from Microsoft and Openai-related domains, such as chat.openai.com, to chatgpt.com, signalling a change in how the platform presents itself and directs traffic.
Perplexity has also made gains, with traffic doubling over the past year, though its numbers remain behind ChatGPT, which has expanded more aggressively.
In contrast, Meta’s platforms have contributed very little referral traffic despite integrating LLaMA. However, now that Meta AI has rolled out globally across core products (such as WhatsApp and Facebook), we anticipate this number will grow.
What do we mean by LLMs?
By LLMs, we are referring to the likes of Perplexity, Claude, and ChatGPT. Basically, anything that matches this RegEx filter (thank you to Max on Slack for helping me expand this):
.*chatgpt.com.*|.*perplexity.*|.*copilot.microsoft.com.*|.*openai.com.*|.*gemini.google.com.*|.*claude.ai.*|.*aitastic.app.*|.*bnngpt.com.*|.*writesonic.com.*|.*copy.ai.*|.*chat-gpt.org.*|.*claudebot.*|.*ai2bot.*|.*ai2bot-dolma.*|.*chatgpt-user.*|.*claude-web.*|.*gptbot.*|.*mistral.ai.*|.*cohere.ai.*|.*huggingface.co.*|.*anthropic.com.*|.*chatglm.cn.*|.*baichuan-ai.com.*|.*zhipu.ai.*|.*palm-ai.google.com.*|.*gemini-api.google.com.*|.*xiaoice.com.*|.*quora.com/poe.*|.*my-ai.snapchat.com.*|.*deepl.com.*|.*you.com.*|.*yiyan.baidu.com.*|.*ai.baidu.com.*|.*amazonbedrock.*|.*anthropic-api.com.*|.*open-assistant.io.*|.*huggingchat.com.*|.*forefront.ai.*|.*character.ai.*|.*chat.suno.com.*|.*deepmind.com.*|.*microsoftazure.ai.*|.*phind.com.*|.*pi.ai.*|.*komo.ai.*|.*vicuna.ai.*|.*firefly.adobe.com.*|.*grok.x.com.*|.*coze.com.*|.*x.ai.*|.*bard.google.com.*|.*lighton.ai.*|.*spellbook.rossintelligence.com.*|.*notion.so/ai.*|.*wordtune.com.*|.*syntesia.io.*|.*hyperwriteai.com.*|.*sap.ai.*|.*reka.ai.*|.*app.loora.ai.*|.*uminal.org.*|.*alphacode.google.com.*|.*ai21.com.*|.*openrouter.ai.*|.*magical.team.*|.*useblackbox.io.*|.*ai-coustics.com.*|.*chinchilla.ai.*|.*d-id.com.*|.*wav.ai.*|.*openchat.so.*|.*floydhub.com.*|.*bing.com/chat.*|.*copilot.azure.com.*|.*turing.microsoft.com.*|.*cosmos.microsoft.com.*|.*orca.microsoft.com.*|.*phi.microsoft.com.*|.*megatron.microsoft.com.*|.*jarvis.microsoft.com.*|.*maia.microsoft.com.*|.*googleother.*|.*gemini.google.com.*|.*palm.google.com.*|.*bard.google.com.*|.*gemini-api.google.com.*|.*alphacode.google.com.*|.*deeplearning.google.*|.*vertexai.google.com.*|.*ai.google.com.*|.*deepmind.google.com.*|.*cloud.google.com/ai.*|.*google-extended.*|.*googleother-image.*|.*googleother-video.*|.*cloud.google.com/vertex-ai.*|.*research.google.com/ai.*|.*ml.googleapis.com.*|.*tensor.google.com.*|.*t5.google.com.*
We are measuring the referral source in Google Analytics 4 (GA4), so this does not take into account Google’s AI Overviews.
Methodology
For this study, we analysed:
- 671,694 registered referrals from LLMs.
- 214,617 “Key events” in GA4 triggered by LLM referrals.
- 188,357,711 organic sessions.
- 62,191,461 “Key events” in GA4 triggered by Organic sessions.
We categorised the websites generating these referrals and organic sessions into 40 categories, ranging from Consumer eCommerce, to SaaS and Travel.
All data originated from GA4, and for all websites submitted, we asked whether they used the standard “Key event” metric. This variation does mean there will be a deviation between websites, as some will have configured custom Key events while others have not.
With the data, we looked for three key points at a website category level:
- Which categories showed, on average, higher LLM traffic engagement than organic sessions over the first three months of 2025.
- Which categories showed, by percentage count, the most instances of higher LLM traffic engagement than organic sessions over the first three months of 2025.
- Which categories showed, on average, the closest metrics with LLM key event conversion rate being within 10% (higher or lower) than the same metric for organic sessions.
Limitations
Discussing the study’s limitations is essential, so I want to highlight a few we encountered during data analysis.
Several submitted datasets showed clear signs of “key event bloat,” where the number of Key events per session was so high that conversion rates exceeded 100%. Some cases even surpassed 200%. To maintain data integrity, we excluded these outliers to prevent them from distorting the overall analysis.
Key event bloat in GA4 is a known issue, especially since the websites we analysed were crowdsourced. Some sites used default key event configurations, while others had custom setups.
This variability makes site-level comparisons unreliable. However, by focusing on sectors instead of individual sites, we can still draw meaningful insights. Sites within the same sector typically share similar goals, leading to a high overlap in Key events.
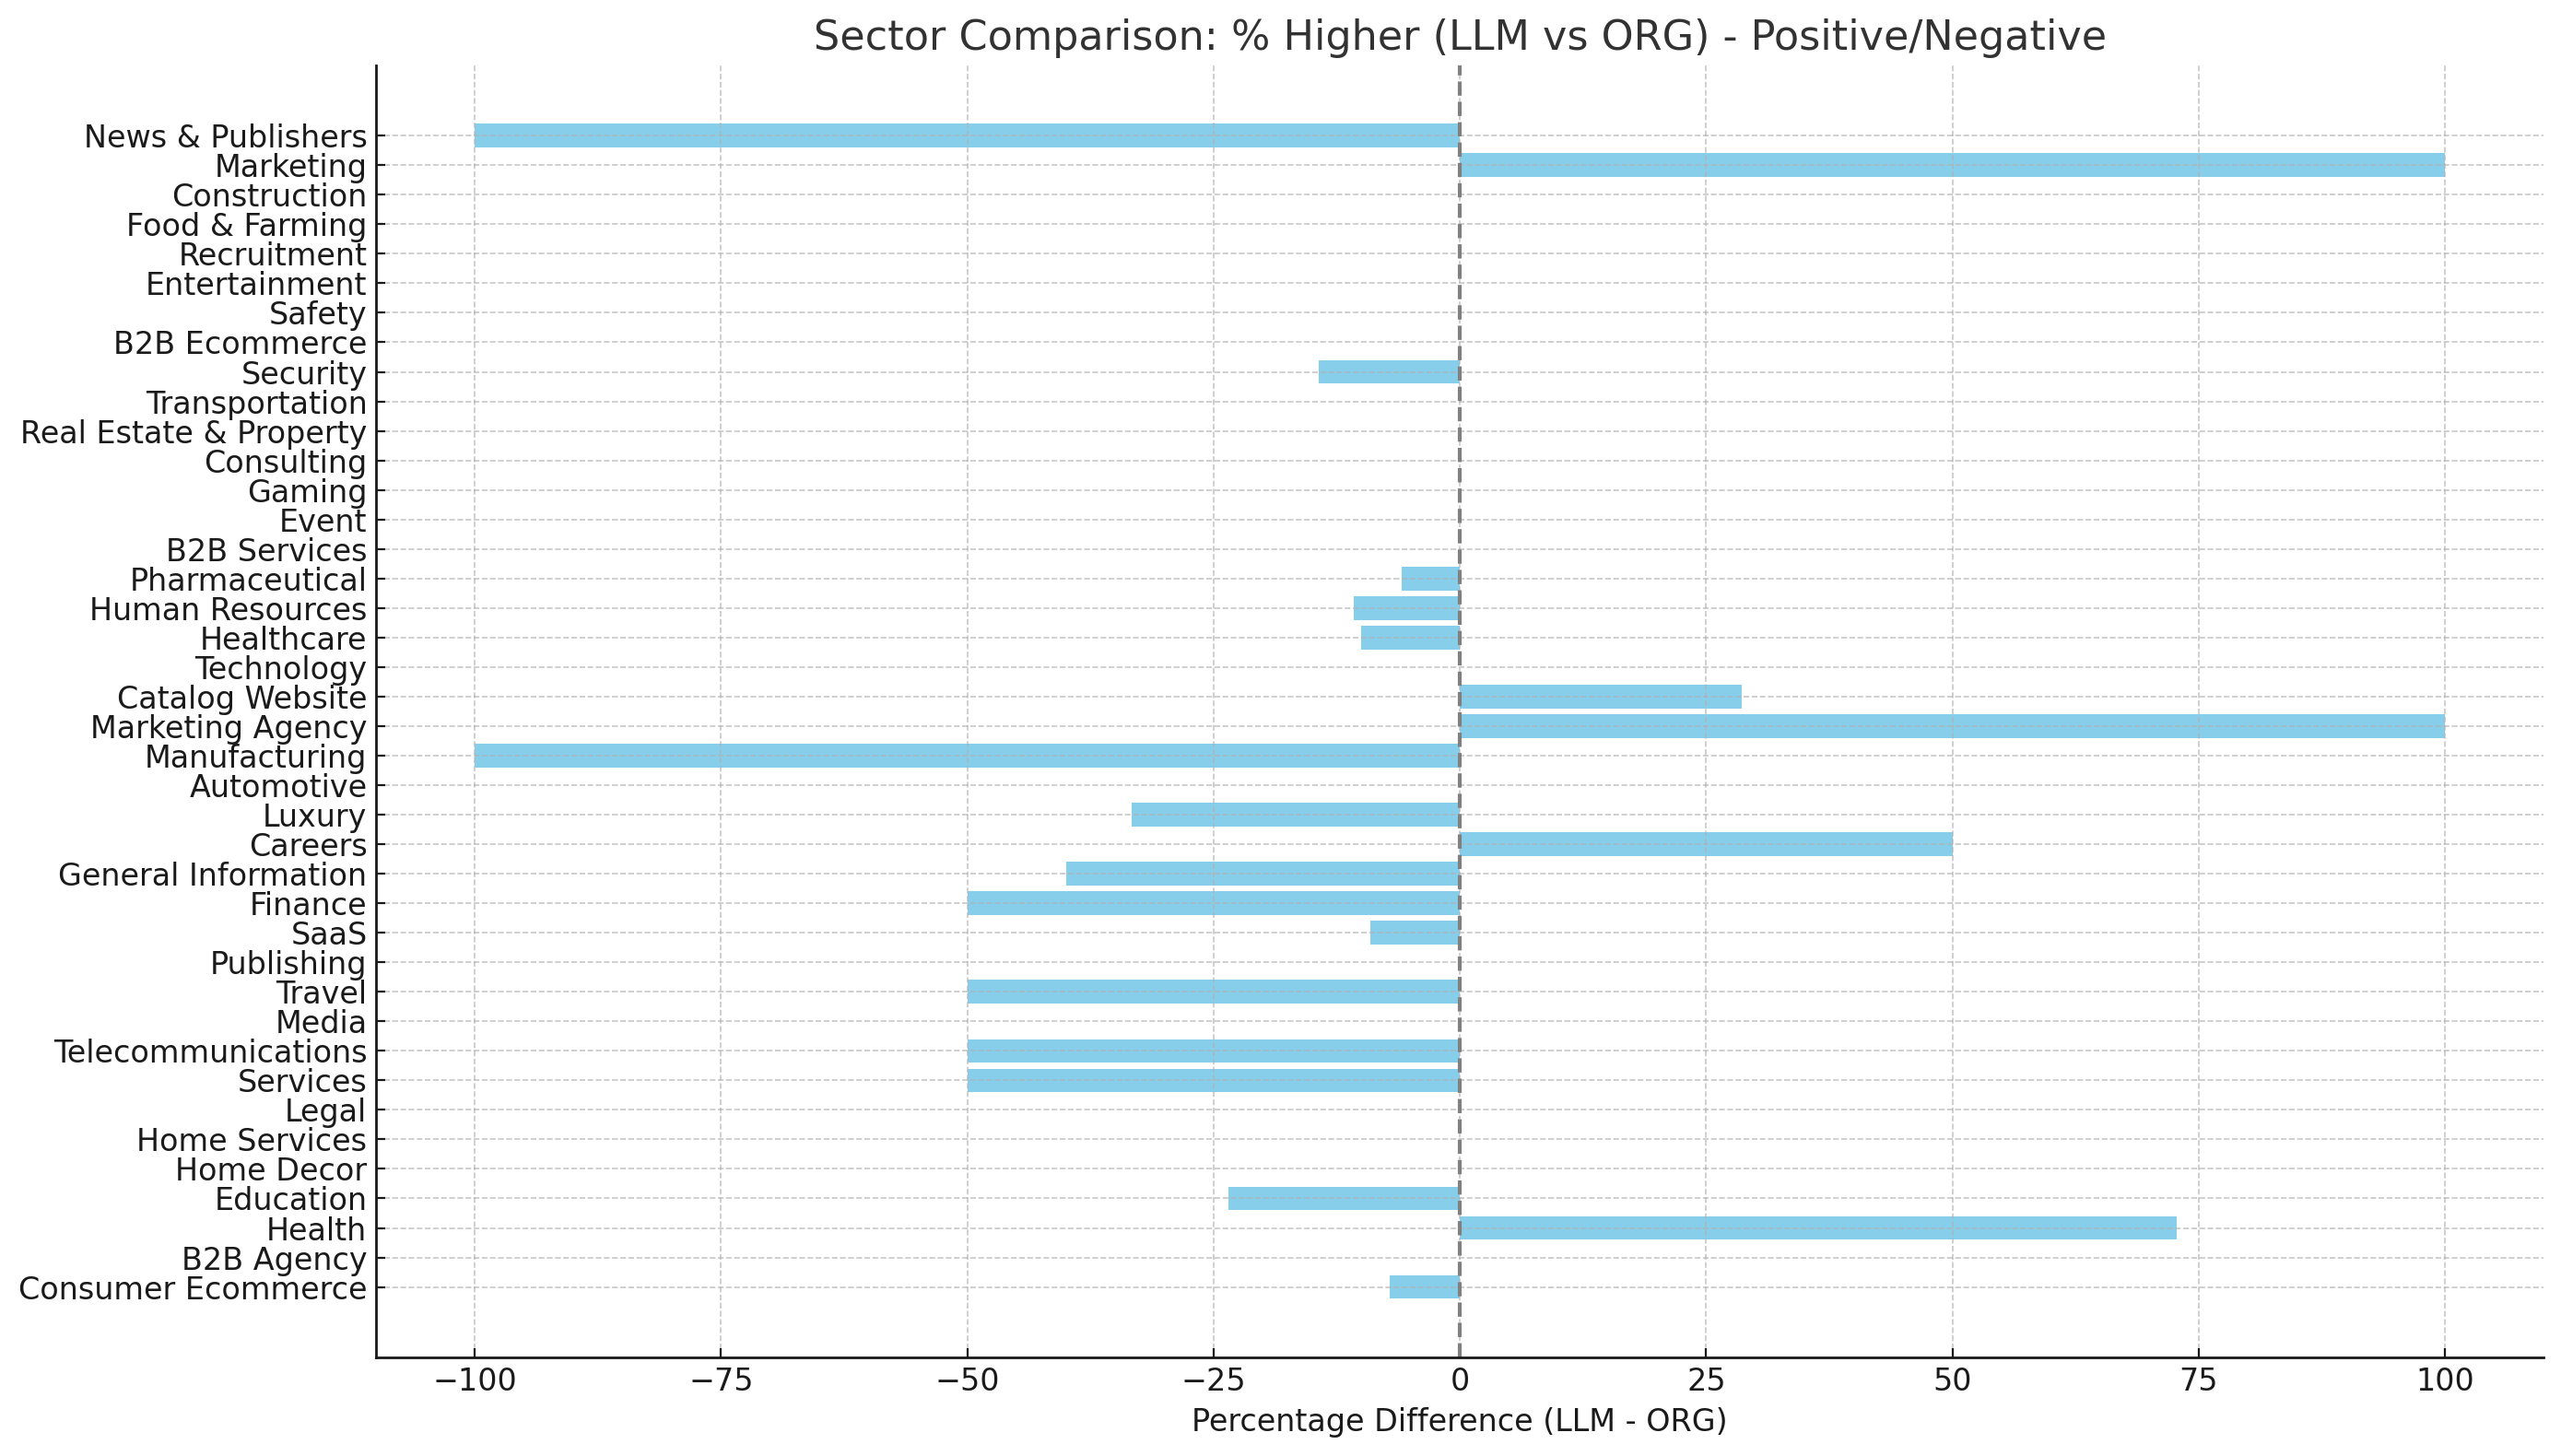
Do users from LLMs engage more on websites than traditional organic users?
In most sectors, Organic KECVR is higher than LLM KECVR, indicating that users arriving through organic search generally have a higher likelihood of engaging (converting) on the website.
Notable exceptions where LLM traffic outperformed organic included:
- Health (13.24% LLM vs. 12.88% organic)
- Careers (22.31% LLM vs. 16.58% organic)
- Catalog Website (2.34% LLM vs. 2.13% organic)
What the data shows
The data reveals a clear pattern of performance variance between LLM conversion rates and traditional organic conversion rates across different sectors.
Websites in the Health, Careers, and “Catalog” categories were the most affected, as a higher percentage of sites in these groups showed LLM key event rates that exceeded those from organic search.
Key event conversion rate benchmarks (LLM vs. Organic)
| Website Sector | Avg. LLM KECVR | Avg. Organic KECVR |
| General Information | 49.44% | 54% |
| Automotive | 0.24% | 0.41% |
| B2B Ecommerce | 2.62% | 2.68% |
| B2B Services | 2.77% | 3.01% |
| Careers | 22.31% | 16.58% |
| Catalog Website | 2.34% | 2.13% |
| Consumer Ecommerce | 17.56% | 24.12% |
| Education | 1.89% | 3.97% |
| Health | 13.24% | 12.88% |
| Human Resources | 2.17% | 8.99% |
| Luxury | 1.99% | 2.13% |
| Pharmaceutical | 4.06% | 8.29% |
| Publishing | 10.49% | 6.57% |
| Real Estate & Property | 6.25% | 2.71% |
| SaaS | 6.69% | 6.71% |
| Telecommunications | 5.73% | 7.35% |
| Travel | 24.25% | 28.97% |
Sector insights
Consumer Ecommerce
LLM traffic significantly lags behind organic (7.14% vs. 24.12%). This sector is highly transactional, with users seeking detailed product information, reviews, comparisons, and pricing — areas where organic search excels. LLM traffic struggles because it often provides general insights rather than the specific, actionable details that drive purchase decisions. For this sector, prioritising organic search optimisation is essential, while LLM traffic might work better for educational content or pre-purchase guidance.
B2B Ecommerce
LLM traffic shows no measurable impact (0%), while organic has a modest 2.68% conversion rate. B2B buyers prioritise accurate product specs, pricing, case studies, and trust signals — types of content that organic search delivers effectively. Their decision-making process is research-intensive, making SEO-focused content with authoritative information far more valuable than LLM traffic-generated content.
Travel
LLM traffic performs relatively well at 24.45%, but still trails organic at 28.97%. This sector is experience-driven, where users rely on detailed reviews, destination guides, user photos, and price comparisons. Organic search excels because it provides rich, curated content that helps users visualise their trips. LLM traffic can support this sector by offering quick recommendations or personalised itinerary planning, but organic search is more trusted for final booking decisions. Travel brands should balance LLM traffic for inspiration with strong SEO content for conversions.
SaaS
LLM traffic and organic are nearly tied (6.69% vs. 6.71%). This close performance suggests that LLM traffic is almost as effective as organic search. SaaS users value personalised guidance, which LLM traffic can deliver, alongside trusted product details available through organic search. While LLM traffic can enhance user engagement by answering questions and explaining complex features, the slight organic edge suggests users may still prefer the authoritative organic search information. SaaS providers should leverage LLM traffic for user support but maintain robust SEO content to drive conversions.
Curious about how much traffic you’re getting from LLM traffic, the value it’s driving, or whether you’re missing out on a major opportunity? Email us today, [email protected].


